Sea Surface Temperature and the Agulhas Current
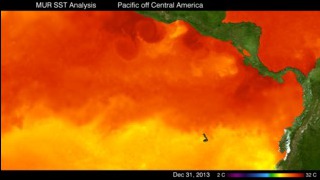
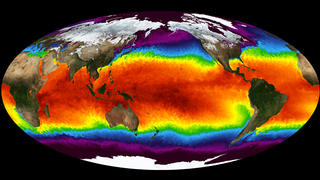
This animation from Jan 2011 to Dec 2013 shows high resolution sea surface temperature (SST) in the Agulhas Retroflection off South Africa. Clearly visible in the Agulhas animation are the eddies that form as a result of the retroflection of the current. These eddies can shed or spin off the main current and travel into the South Atlantic.
The MUR SST dataset combines data from the Advanced Very High Resolution Radiometer (AVHRR), Moderate Resolution Imaging Spectroradiometer (MODIS), and Advanced Microwave Scanning Radiometer for EOS (AMSR-E) instruments, and currently the NAVY Windsat Satellite. More details of the MUR data set may be found at PO.DAAC
Eddies highlight ocean currents in the Agulhas area.
For More Information
Credits
Please give credit for this item to:
NASA
-
Visualizer
- Charles Thompson (NASA/JPL CalTech)
-
Technical support
- Marit Jentoft-Nilsen (Global Science and Technology, Inc.)
Datasets used
-
MUR SST (Multi-scale Ultra-high Resolution (MUR) Sea Surface Temperature (SST) Analysis)
ID: 845
Note: While we identify the data sets used on this page, we do not store any further details, nor the data sets themselves on our site.
Related
- ID: 30486
 Hyperwall Visual
 - ID: 30008
 Hyperwall Visual
Release date
This page was originally published on Friday, February 28, 2014.
This page was last updated on Saturday, February 1, 2025 at 12:25 AM EST.