Monthly Cloud Water Content (Aqua/MODIS)
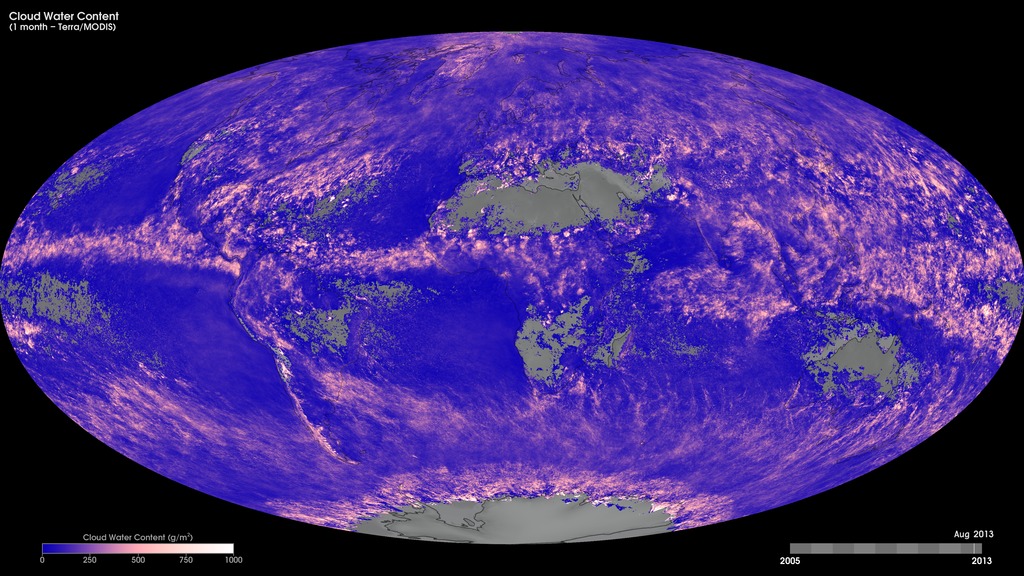
Have you ever wondered how much water is in clouds? These maps show monthly cloud water content from July 2002 to the present, produced using data from the Moderate Resolution Imaging Spectroradiometer (MODIS) instrument onboard NASA’s Aqua satellite. Cloud water content is a measure of how many grams of water per square meter you would get if you drained all the water out of the clouds into a flat layer on the ground. Light pink to white shades show areas of clouds with as much as 1000 grams of water per square meter; pink shades show areas with about 500 grams of water per square meter, and dark purple shows areas with little or no cloud water content. In short, the more water in a cloud, the more it reflects sunlight back to space and the more it cools Earth's surface. Cloud water content as well as cloud particle size are also important for global studies of precipitation.
Monthly Aqua/MODIS cloud water content, July 2002 to the present.
For More Information
Credits
Based on imagery by Reto Stockli, NASA's Earth Observatory, using data provided by the MODIS Atmosphere Science Team, NASA Goddard Space Flight Center.
-
Visualizers
- Marit Jentoft-Nilsen (Global Science and Technology, Inc.)
- Reto Stockli (NASA/GSFC)
Missions
This page is related to the following missions:Series
This page can be found in the following series:Datasets used
-
Cloud Water Content [Aqua: MODIS]
ID: 877
Note: While we identify the data sets used on this page, we do not store any further details, nor the data sets themselves on our site.
Related
- ID: 30387
 Hyperwall Visual
Release date
This page was originally published on Thursday, October 24, 2013.
This page was last updated on Sunday, February 2, 2025 at 11:31 PM EST.