Earth at Night 2001
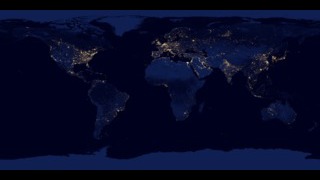
This is what the Earth looks like at night. Can you find your favorite country or city? Surprisingly, city lights make this task quite possible. Human-made lights highlight particularly developed or populated areas of the Earth's surface, including the seaboards of Europe, the eastern United States, and Japan. Many large cities are located near rivers or oceans so that they can exchange goods cheaply by boat. Particularly dark areas include the central parts of South America, Africa, Asia, and Australia. The above image is actually a composite of hundreds of pictures made by the Defense Meteorological Satellite Program (DMSP) currently operates four satellites carrying the Operational Linescan System (OLS) in low-altitude polar orbits. Three of these satellites record nighttime data. The DMSP-OLS has a unique capability to detect low levels of visible-near infrared (VNIR) radiance at night. With the OLS 'VIS' band data it is possible to detect clouds illuminated by moonlight, plus lights from cities, towns, industrial sites, gas flares, and ephemeral events such as fires and lightning-illuminated clouds.
The Nighttime Lights of the World data set is compiled from the October 1994 - March 1995 DMSP nighttime data collected when moonlight was low. Using the OLS thermal infrared band, areas containing clouds were removed and the remaining area used in the time series. This animation is derived from an image created by Craig Mayhew and Robert Simmon from data provided by Christopher Elvidge of the NOAA National Geophysical Data Center.
Human-made lights highlight particularly developed or populated areas of the Earth's surface, including the seaboards of Europe, the eastern United States, and Japan.

Human-made lights highlight particularly developed or populated areas of the Earth's surface, including the seaboards of Europe.
A Flat Earth lets you see human-made lights which are highlighted by developed or populated areas of the Earth's surface, including the seaboards of Europe, the eastern United States, and Japan.
Human-made lights highlight particularly developed or populated areas of the Earth's surface, including the seaboards of Europe, the eastern United States, and Japan.
Human-made lights highlight particularly developed or populated areas of the Earth's surface, including the seaboards of the eastern United States.
Video slate image reads, "Earth at Night
Human-made lights highlight particularly developed or populated areas of the Earth's surface, including the seaboards of Europe, the eastern United States, and Japan. Many large cities are located near rivers or oceans so that they can excange goods cheaply by boat. Particularly dare areas include the central parts of South America, Africa, Asia, and Australia."
For More Information
See Visible Earth
Credits
Please give credit for this item to:
NASA/Goddard Space Flight Center
Scientific Visualization Studio
-
Animators
- Stuart A. Snodgrass (Global Science and Technology, Inc.)
- Robert Simmon (SSAI)
- Craig Mayhew (Raytheon)
-
Scientists
- Christopher Elvidge (NOAA/NGDC)
- Marc Imhoff (NASA/GSFC)
Series
This page can be found in the following series:Datasets used
-
Earth at Night [DMSP: OLS]
ID: 286
Note: While we identify the data sets used on this page, we do not store any further details, nor the data sets themselves on our site.
Related
- ID: 30028
 Hyperwall Visual
Release date
This page was originally published on Friday, October 19, 2001.
This page was last updated on Wednesday, May 3, 2023 at 1:57 PM EDT.