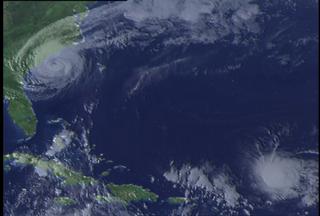
Hurricane Bonnie from TRMM: August 22, 1998
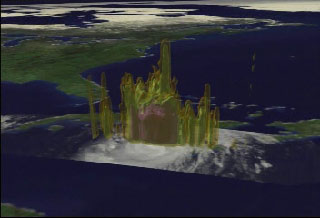
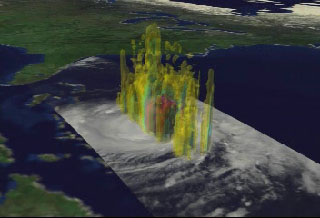
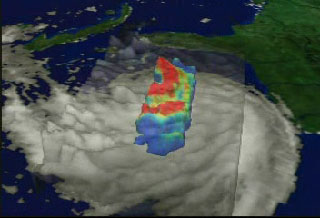
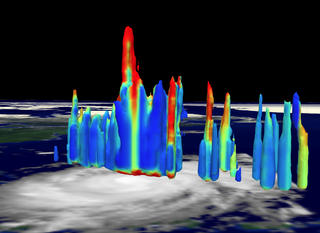
A fly-in to Hurricane Bonnie on August 22, 1998, showing the three-dimensional structure of the precipitation as measured by the Precipitation Radar instrument on TRMM. In this animation, a surface of constant precipitation is colored by the value of the precipitation on the ground under the surface.

Hurricane Bonnie; looking inside the storm.
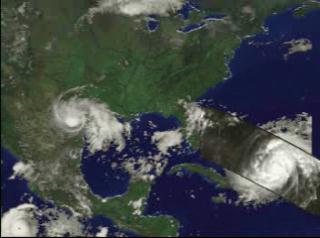
Hurricane Bonnie; with GOES cloud cover
Video slate image reads "TRMM Hurricane Bonnie August 25, 1998 Precipitation Radar Data and Visible and Infrared Scanner (and GOES Satellite Data)".
Credits
Please give credit for this item to:
NASA/Goddard Space Flight Center
Scientific Visualization Studio
-
Animator
-
Greg Shirah
(NASA/GSFC)

-
Greg Shirah
(NASA/GSFC)
-
Scientist
- Chris Kummerow (NASA/GSFC)
Missions
This page is related to the following missions:Series
This page can be found in the following series:Datasets used
-
[TRMM: PR]
ID: 109 -
[TRMM: VIRS]
ID: 111
Note: While we identify the data sets used on this page, we do not store any further details, nor the data sets themselves on our site.
Related
- ID: 1150
 Visualization
 - ID: 1031
- ID: 1032
- ID: 210
 Visualization
 - ID: 211
- ID: 222

- ID: 227
Release date
This page was originally published on Thursday, December 31, 1998.
This page was last updated on Wednesday, May 3, 2023 at 1:59 PM EDT.