Fermi's 14-Year Time-Lapse of the Gamma-Ray Sky
From solar flares to black hole jets: NASA’s Fermi Gamma-ray Space Telescope has produced a unique time-lapse tour of the dynamic high-energy sky. Fermi Deputy Project Scientist Judy Racusin narrates this movie, which compresses 14 years of gamma-ray observations into 6 minutes.
Credit: NASA’s Goddard Space Flight Center and NASA/DOE/LAT Collaboration
Music: "Expanding Shell" written and produced by Lars Leonhard.
Watch this video on the NASA Goddard YouTube channel.
Complete transcript available.
Video descriptive text available.
The cosmos comes alive in an all-sky time-lapse movie made from 14 years of data acquired by NASA’s Fermi Gamma-ray Space Telescope. Our Sun, occasionally flaring into prominence, serenely traces a path through the sky against the backdrop of high-energy sources within our galaxy and beyond.
Gamma rays are the highest-energy form of light. The movie shows the intensity of gamma rays with energies above 200 million electron volts (MeV) detected by Fermi’s Large Area Telescope (LAT) between August 2008 and August 2022. For comparison, visible light has energies between 2 and 3 electron volts. Brighter colors mark the locations of more intense gamma-ray sources.
The movie shows the sky in two different views. The rectangular view shows the entire sky with the center of our galaxy in the middle. This highlights the central plane of the Milky Way, which glows in gamma rays produced from cosmic rays striking interstellar gas and starlight. It’s also flecked with many other sources, including neutron stars and supernova remnants. Above and below this central band, we’re looking out of our galaxy and into the wider universe, peppered with bright, rapidly changing sources.
Most of these are actually distant galaxies, and they’re better seen in a different view centered on our galaxy’s north and south poles. Each of these galaxies, called blazars, hosts a central black hole with a mass of a million or more Suns. Somehow, the black holes produce extremely fast-moving jets of matter, and with blazars we’re looking almost directly down one of these jets, a view that enhances their brightness and variability.
Many of these galaxies are extremely far away. For example, the light from a blazar known as 4C +21.35 has been traveling for 4.6 billion years, which means that a flare up we see today actually occurred as our Sun and solar system were beginning to form. Other bright blazars are more than twice as distant, and together provide striking snapshots of black hole activity throughout cosmic time.
Not seen in the time-lapse are many short-duration events that Fermi studies, such as gamma-ray bursts, the most powerful cosmic explosions. This is a result of processing data across several days to sharpen the images.
Technical description. The individual frames of the animation are spatially and temporally smoothed maps of gamma-ray intensity observed by the Fermi LAT between Aug. 10, 2008, and Aug. 2, 2022. Fermi completes 16 orbits every day. Because the LAT has an extremely broad field of view and its orientation is shifted on alternate orbits, it normally observes the entire sky several times every day. The maps are based on Pass 8 source class gamma rays, and for a reasonably good combination of photon statistics and per-photon angular resolution, photons with energies of 200 MeV or greater were selected. Because the limb of the Earth is an extremely bright source of high-energy gamma rays from galactic cosmic rays that skim the upper atmosphere, only gamma rays with arrival directions within 100 degrees of the zenith were included. The sky maps were binned by energy and corresponding maps of the instrumental exposure (which also depends on energy) were made using the pointing and livetime history of the LAT. The resulting map "cubes" of counts and exposure were then ratioed to derive the gamma-ray intensity for each energy bin, and then summed over energy to make intensity maps for the >200 MeV range. As the statistics are fairly limited on one-day time scales, the daily maps were smoothed spatially with a 2-dimensional Gaussian of FWHM 2 degrees and temporally (via a 1-dimensional gaussian weighting of FWHM = 4.7 days) to suppress statistical fluctuations. The temporal smoothing meant that variations on time scales shorter than about 5 days were suppressed in this process. A few times during the 14 years covered by the images, the LAT was in safe mode for one reason or another, and for intervals of up to several days was not taking data. Additionally, particularly later in the mission, the sky coverage was sometimes incomplete on a daily basis. The result is a few short gaps in the visualization and sometimes darker areas in daily images owing to limited coverage of those regions.
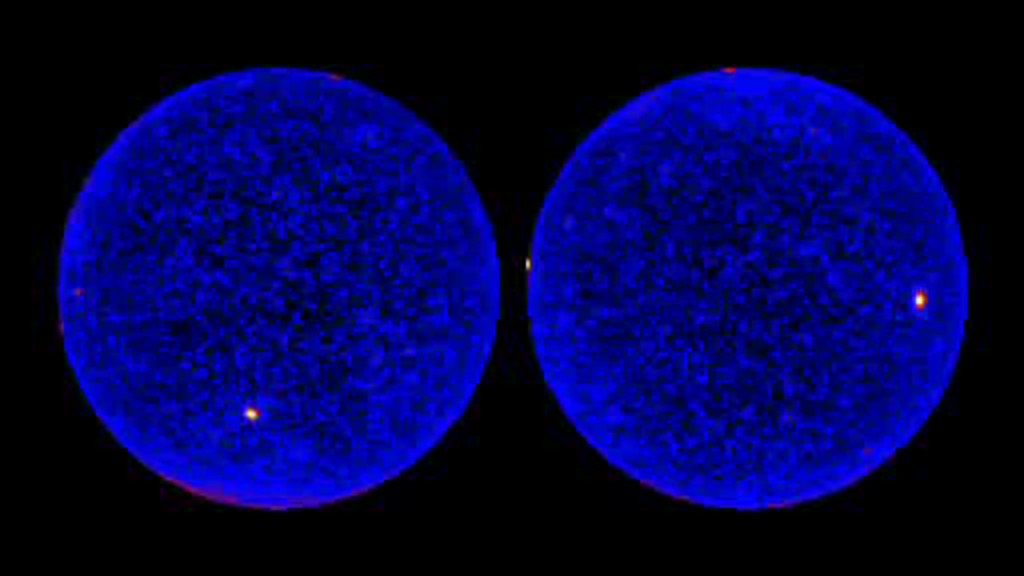
The entire gamma-ray sky is shown as two circular views centered on the north (left) and south poles of our Milky Way galaxy in this 14-year time-lapse of the gamma-ray sky. The central plane of our galaxy wraps around the edges of both circles, suppressing its glow and improving the view of black-hole-powered galaxies in the distant universe. Their gamma rays come from jets produced by supermassive black holes in distant galaxies that point almost directly toward Earth, which enhances their brightness and variability. Over a few days, these galaxies can erupt to become some of the brightest objects in the gamma-ray sky and then fade to obscurity. A moving source, our Sun, can be seen arcing up and down the circles as it appears to move through the sky, a reflection of Earth’s annual orbital motion. Watch for strong flares that occasionally brighten the Sun. In these maps, brighter colors indicate more intense gamma-ray sources detected by Fermi’s Large Area Telescope from Aug. 10, 2008, to Aug. 2, 2022.
Credit: NASA’s Goddard Space Flight Center and NASA/DOE/LAT Collaboration
Music: "Expanding Shell" written and produced by Lars Leonhard.
Watch this video on the NASA.gov Video YouTube channel.
Complete transcript available.
The entire gamma-ray sky is unwrapped into a rectangular map, with the center of our Milky Way galaxy located in the middle, in this 14-year time-lapse of the gamma-ray sky. A moving source, our Sun, can be seen following a curving path through the sky, a reflection of Earth’s annual orbital motion. Watch for strong flares that occasionally brighten the Sun. The central plane of our galaxy is on full display, glowing in gamma rays produced when accelerated particles (cosmic rays) interact with interstellar gas and starlight. Pulsars and supernova remnants, all bright gamma-ray sources for Fermi, also fleck the Milky Way band. Above and below the bright central plane, where our view of the broader cosmos becomes clearer, splotches of color brighten and fade. These sources are jets of particles moving at nearly the speed of light driven by supermassive black holes in distant galaxies. The jets happen to point almost directly toward Earth, which enhances their brightness and variability. Over a few days, these galaxies can erupt to become some of the brightest objects in the gamma-ray sky and then fade to obscurity. In these maps, brighter colors indicate more intense gamma-ray sources detected by Fermi’s Large Area Telescope from Aug. 10, 2008, to Aug. 2, 2022.
Credit: NASA’s Goddard Space Flight Center and NASA/DOE/LAT Collaboration
Music: "Expanding Shell" written and produced by Lars Leonhard.
Watch this video on the NASA Goddard YouTube channel.
Complete transcript available.
An abbreviated version of the narrated tour for use in social media.
Music: "Expanding Shell" written and produced by Lars Leonhard.
Credit: NASA’s Goddard Space Flight Center and NASA/DOE/LAT Collaboration
Complete transcript available.
The Fermi time-lapse set within the frame of a fireplace, complete with an appropriate soundtrack. Warm up to the gamma-ray sky!
Credit: NASA’s Goddard Space Flight Center and NASA/DOE/LAT Collaboration
Watch this video on the NASA.gov Video YouTube channel.
Complete transcript available.

An overlay for the rectangular time-lapse that identifies selected blazars.
Credit: NASA’s Goddard Space Flight Center
An overlay for the dual-circle time-lapse that identifies selected blazars.
Credit: NASA’s Goddard Space Flight Center
An overlay for the rectangular time-lapse showing the Sun's annual path, also know as the ecliptic.
Credit: NASA’s Goddard Space Flight Center
For More Information
Credits
Please give credit for this item to:
NASA's Goddard Space Flight Center. However, individual items should be credited as indicated above.
-
Producer
- Scott Wiessinger (eMITS)
-
Science writer
- Francis Reddy (University of Maryland College Park)
-
Scientist
- Judith Racusin (NASA/GSFC)
-
Narrator
- Judith Racusin (NASA/GSFC)
-
Visualizer
- Seth Digel (SLAC National Accelerator Laboratory)
Missions
This page is related to the following missions:Series
This page can be found in the following series:Related
- ID: 10407
 Produced Video
Used as a Source In
- ID: 14800
 Produced Video
Release date
This page was originally published on Wednesday, December 20, 2023.
This page was last updated on Tuesday, May 27, 2025 at 12:18 AM EDT.