Black Hole Week: Black Hole GIFs
Black Hole Week
This page provides social media assets used during previous celebrations of Black Hole Week.
Join in! Below, you'll find many GIFs to use.

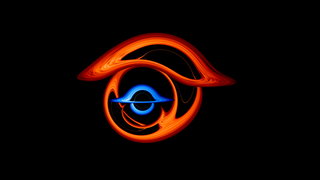
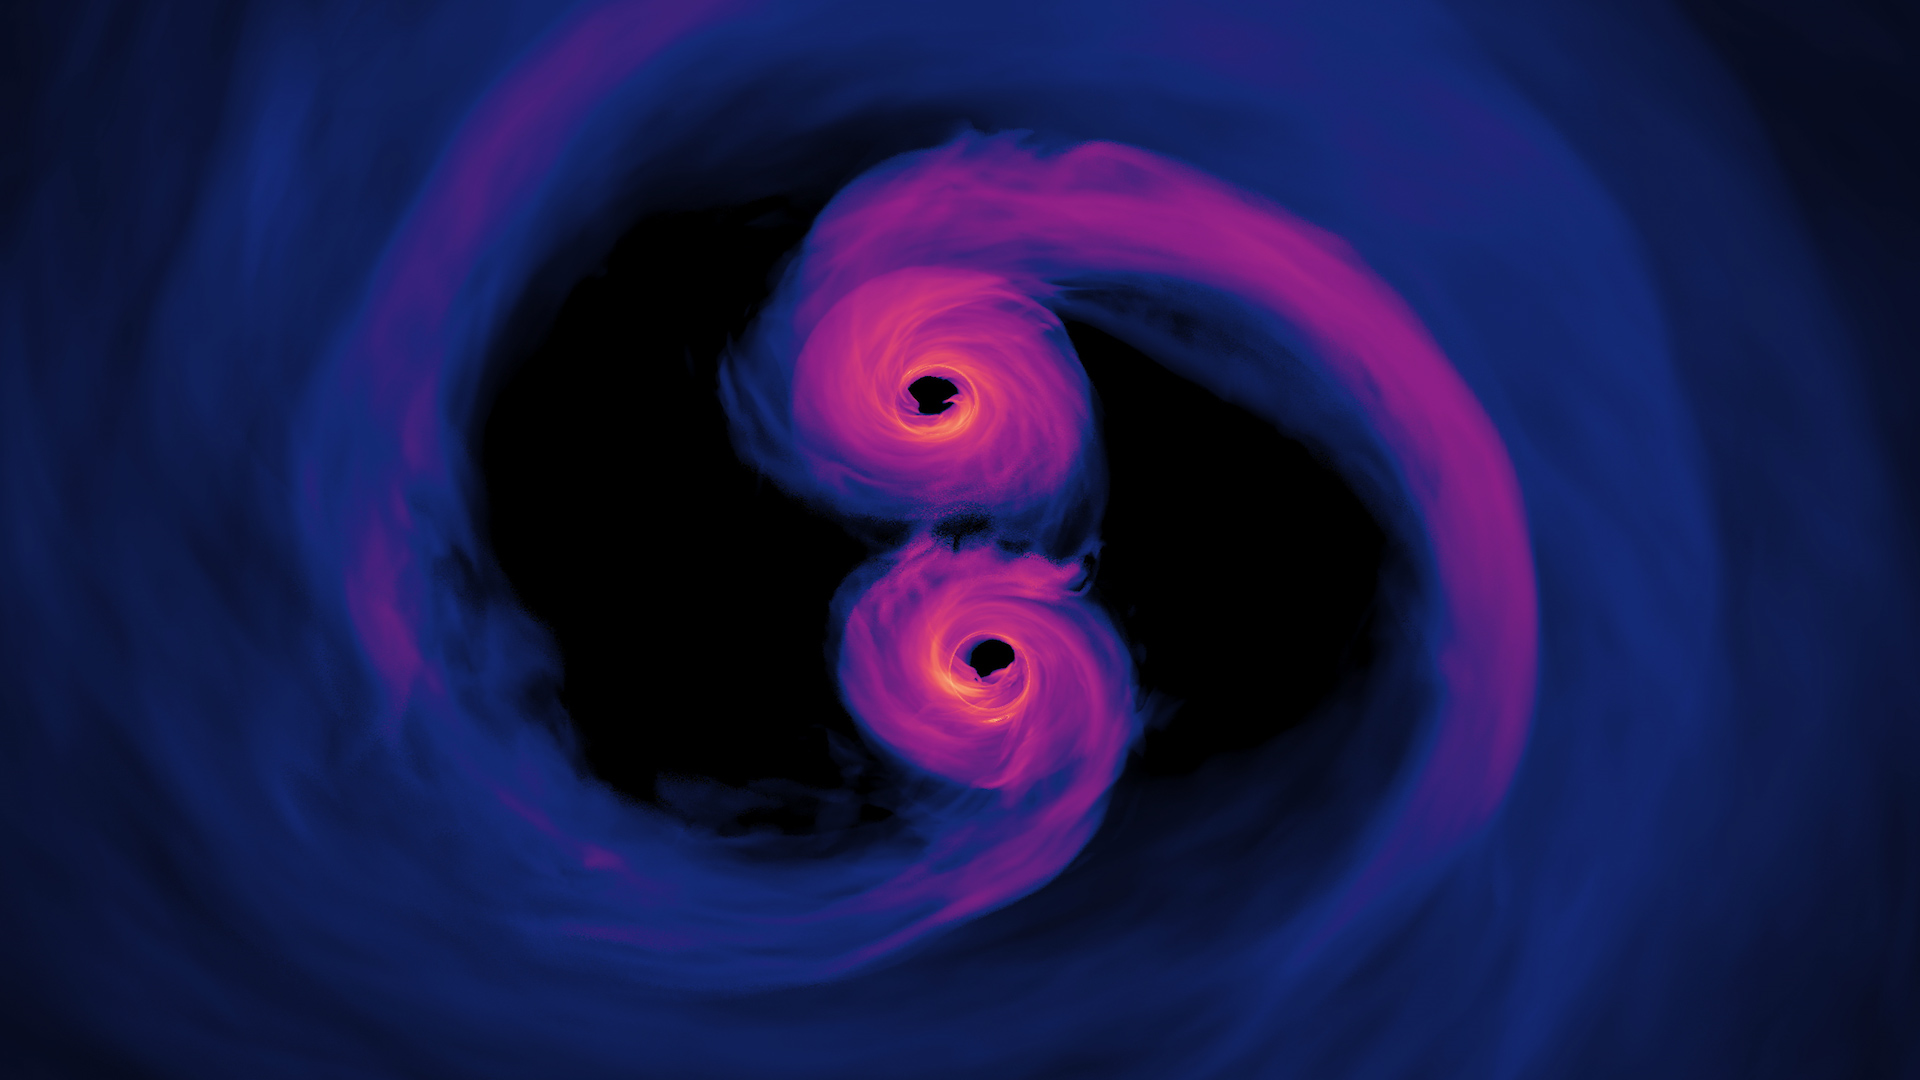
In this visualization, a binary system containing two supermassive black holes and their accretion disks circle each other, revealing the dramatic distortions produced by their gravity. The different colors of the accretion disks make it easier to track where light from each black hole turns up.
Credit: NASA’s Goddard Space Flight Center/Jeremy Schnittman and Brian P. Powell

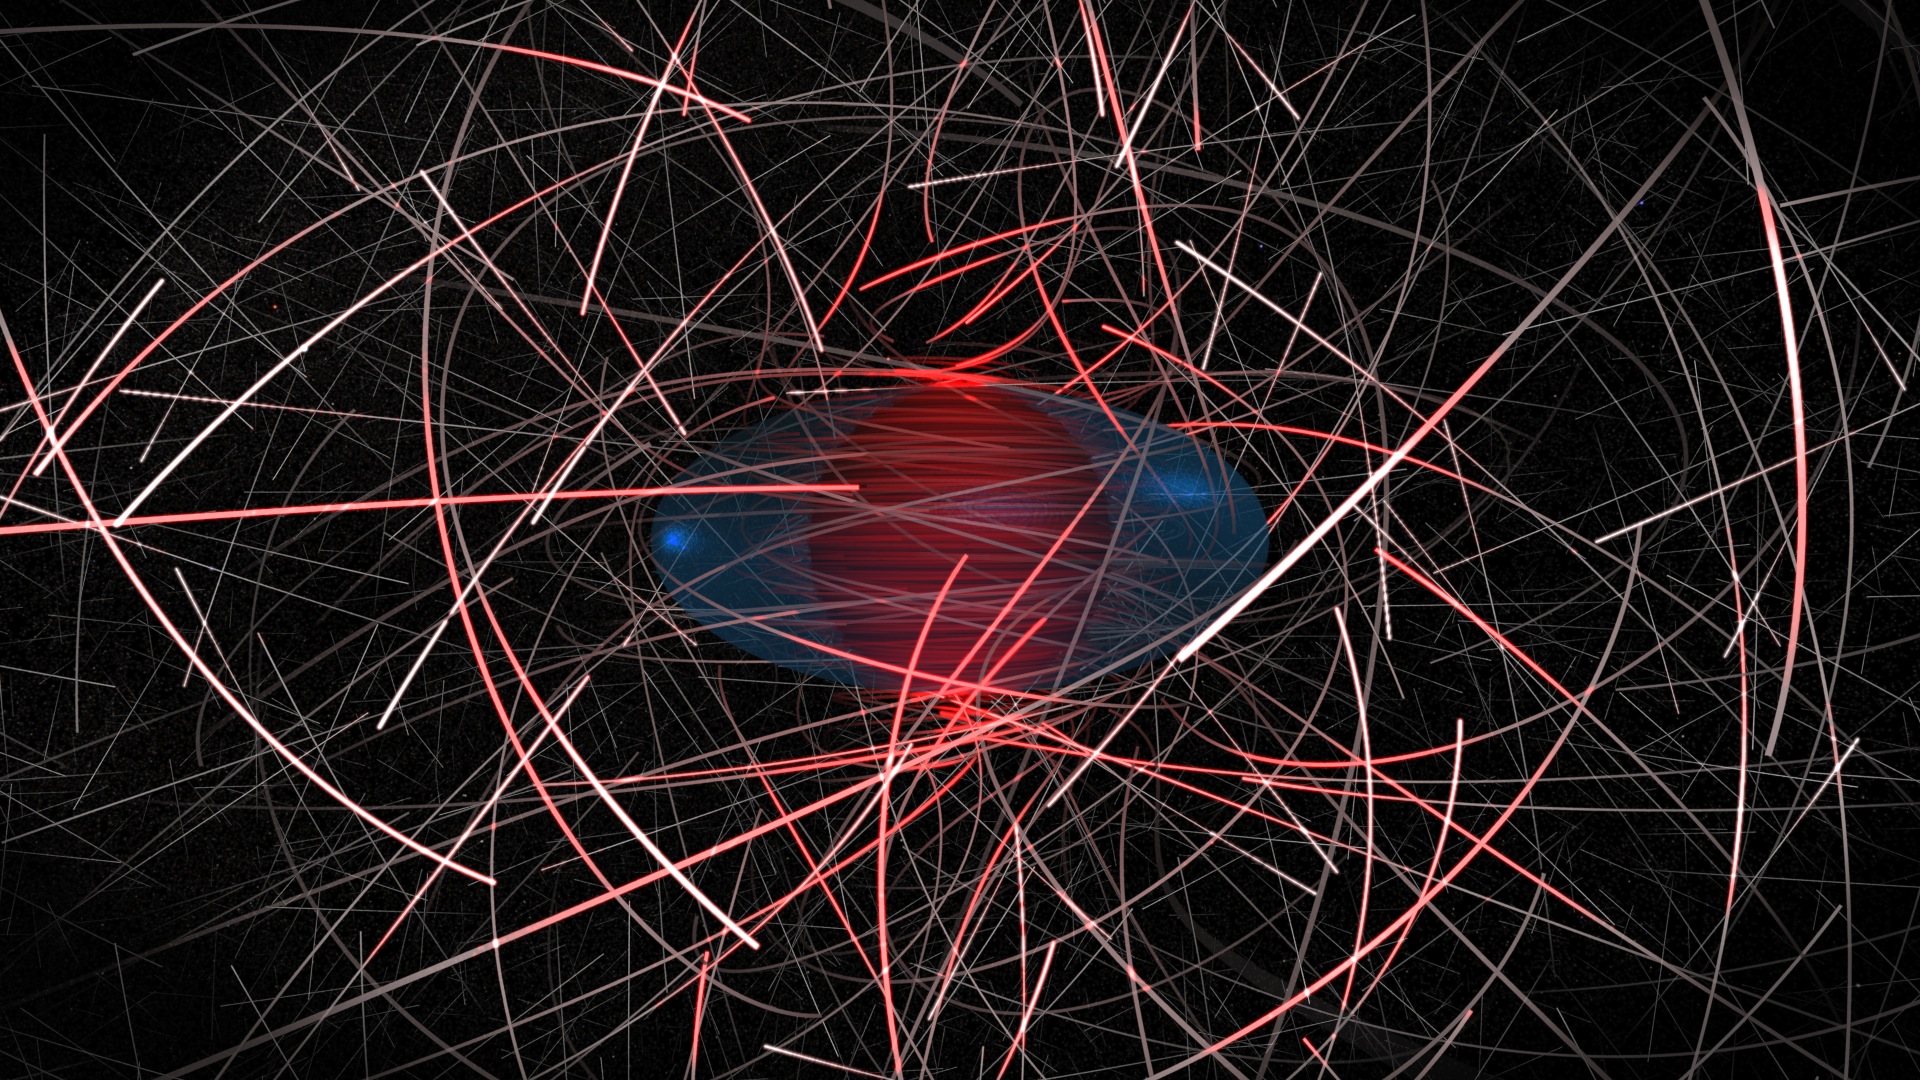
This simulation explores the connection between two of the most elusive phenomena in the universe, black holes and dark matter. In the visualization, dark matter particles are gray spheres attached to shaded trails representing their motion. Redder trails indicate particles closer to the black hole's event horizon. The ergosphere, where all matter and light must follow the black hole's spin, is shown in teal.
Credit: NASA's Goddard Space Flight Center

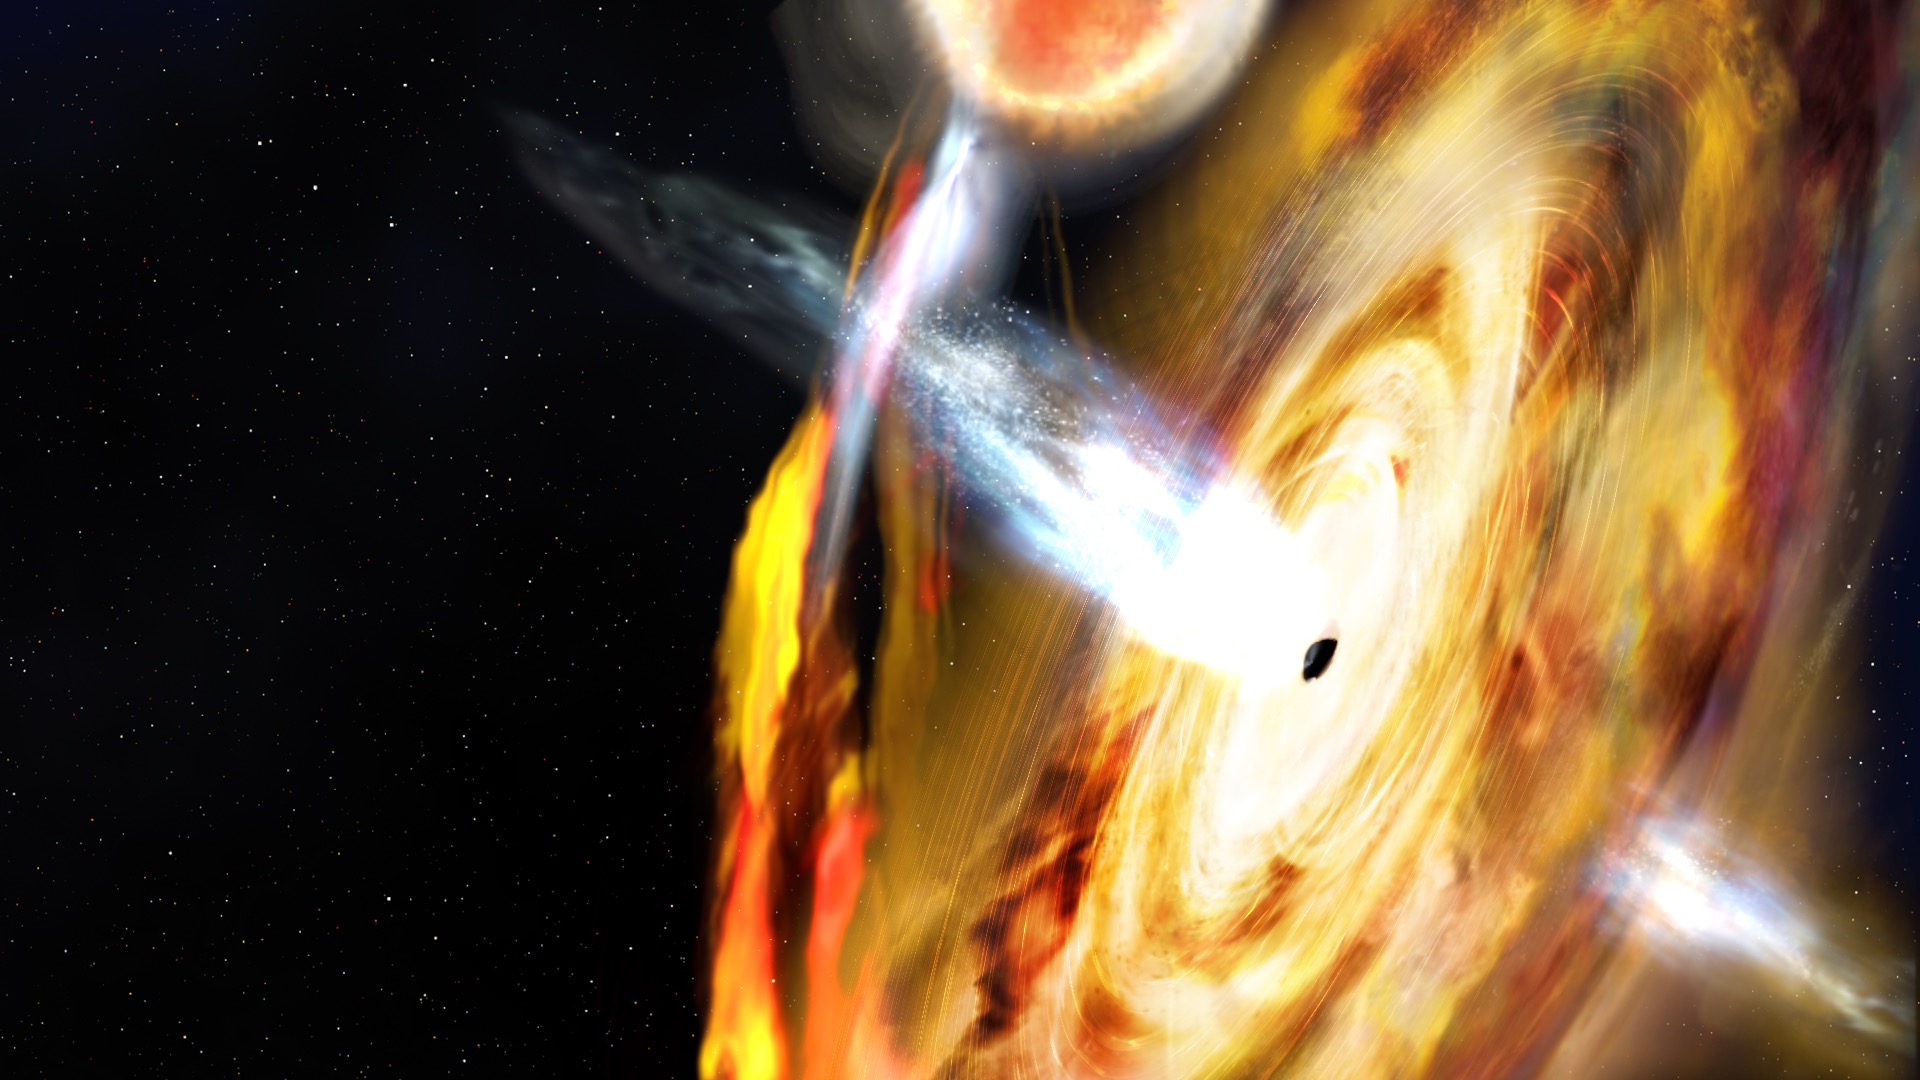
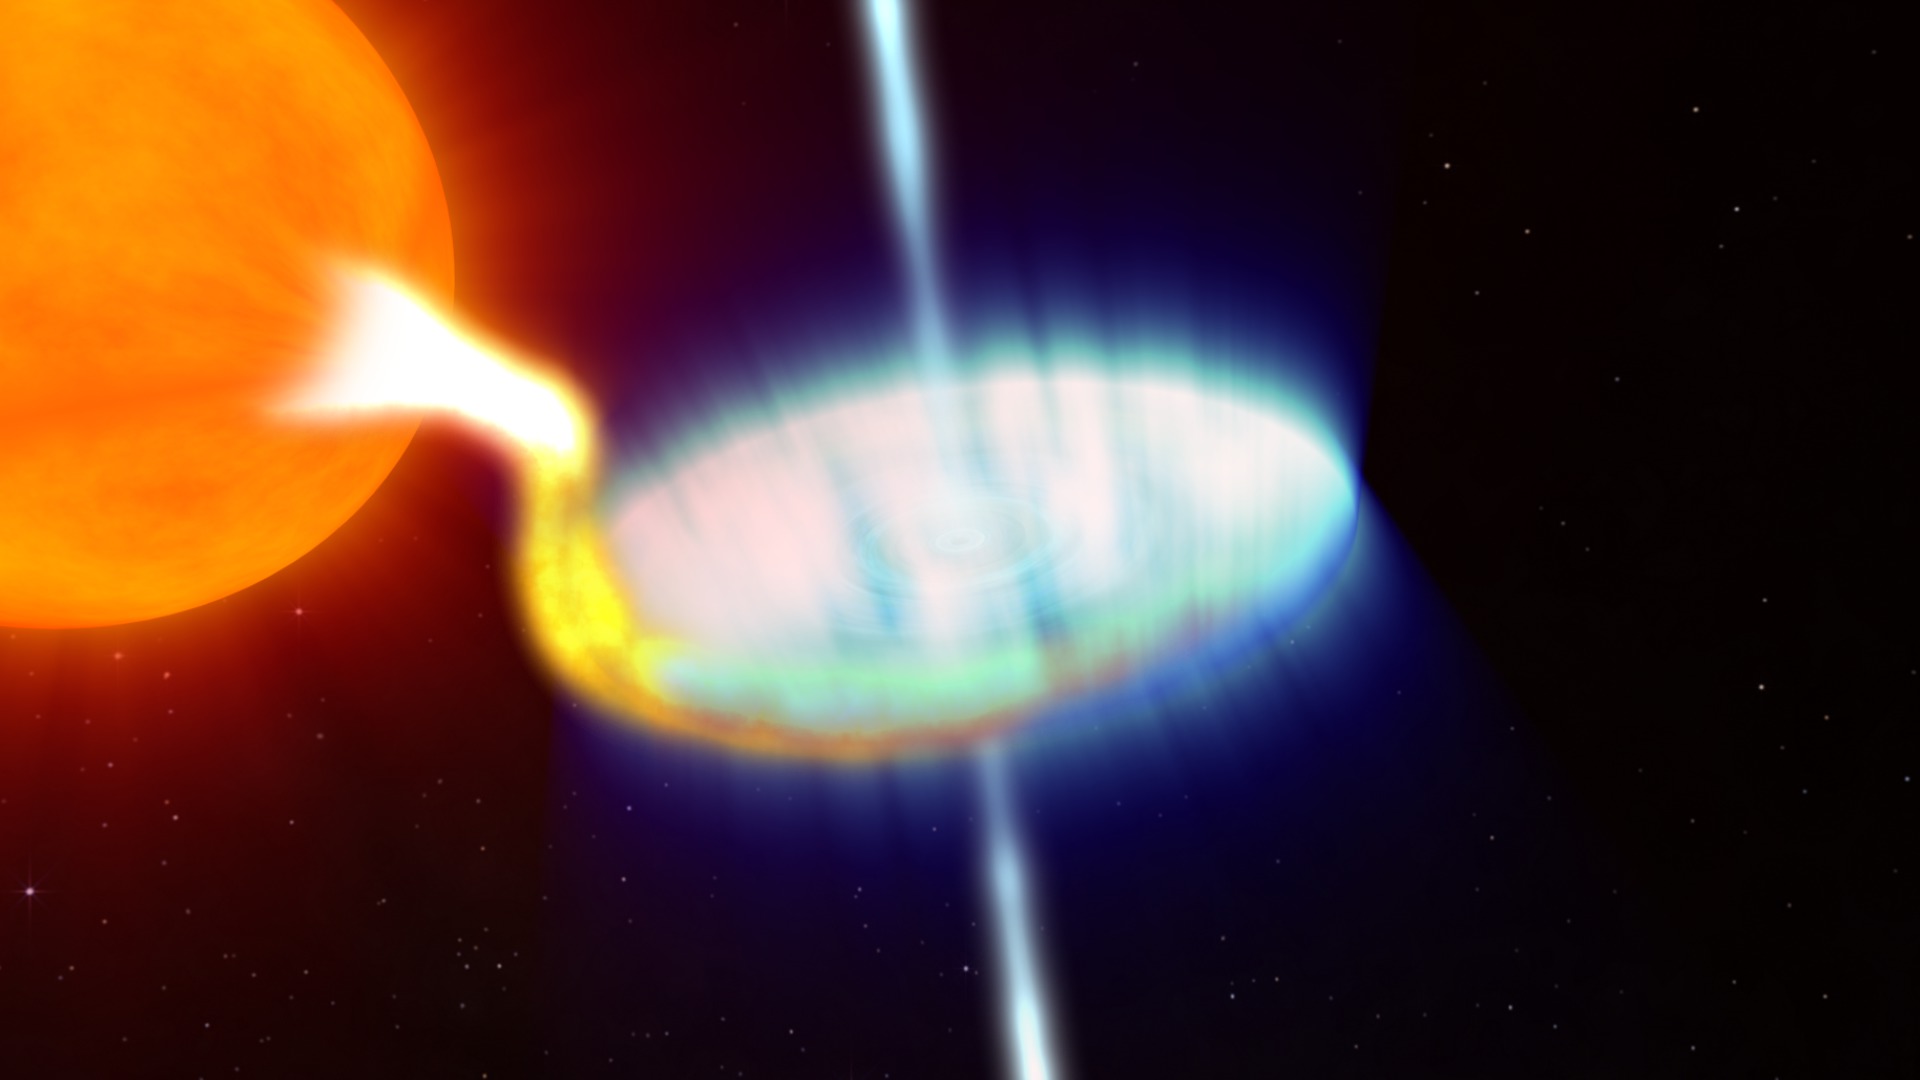
In this illustration, a black hole pulls material from a neighboring star and into its accretion disk. Above the disk is a region of subatomic particles called the corona.
Credit: Aurore Simonnet and NASA’s Goddard Space Flight Center
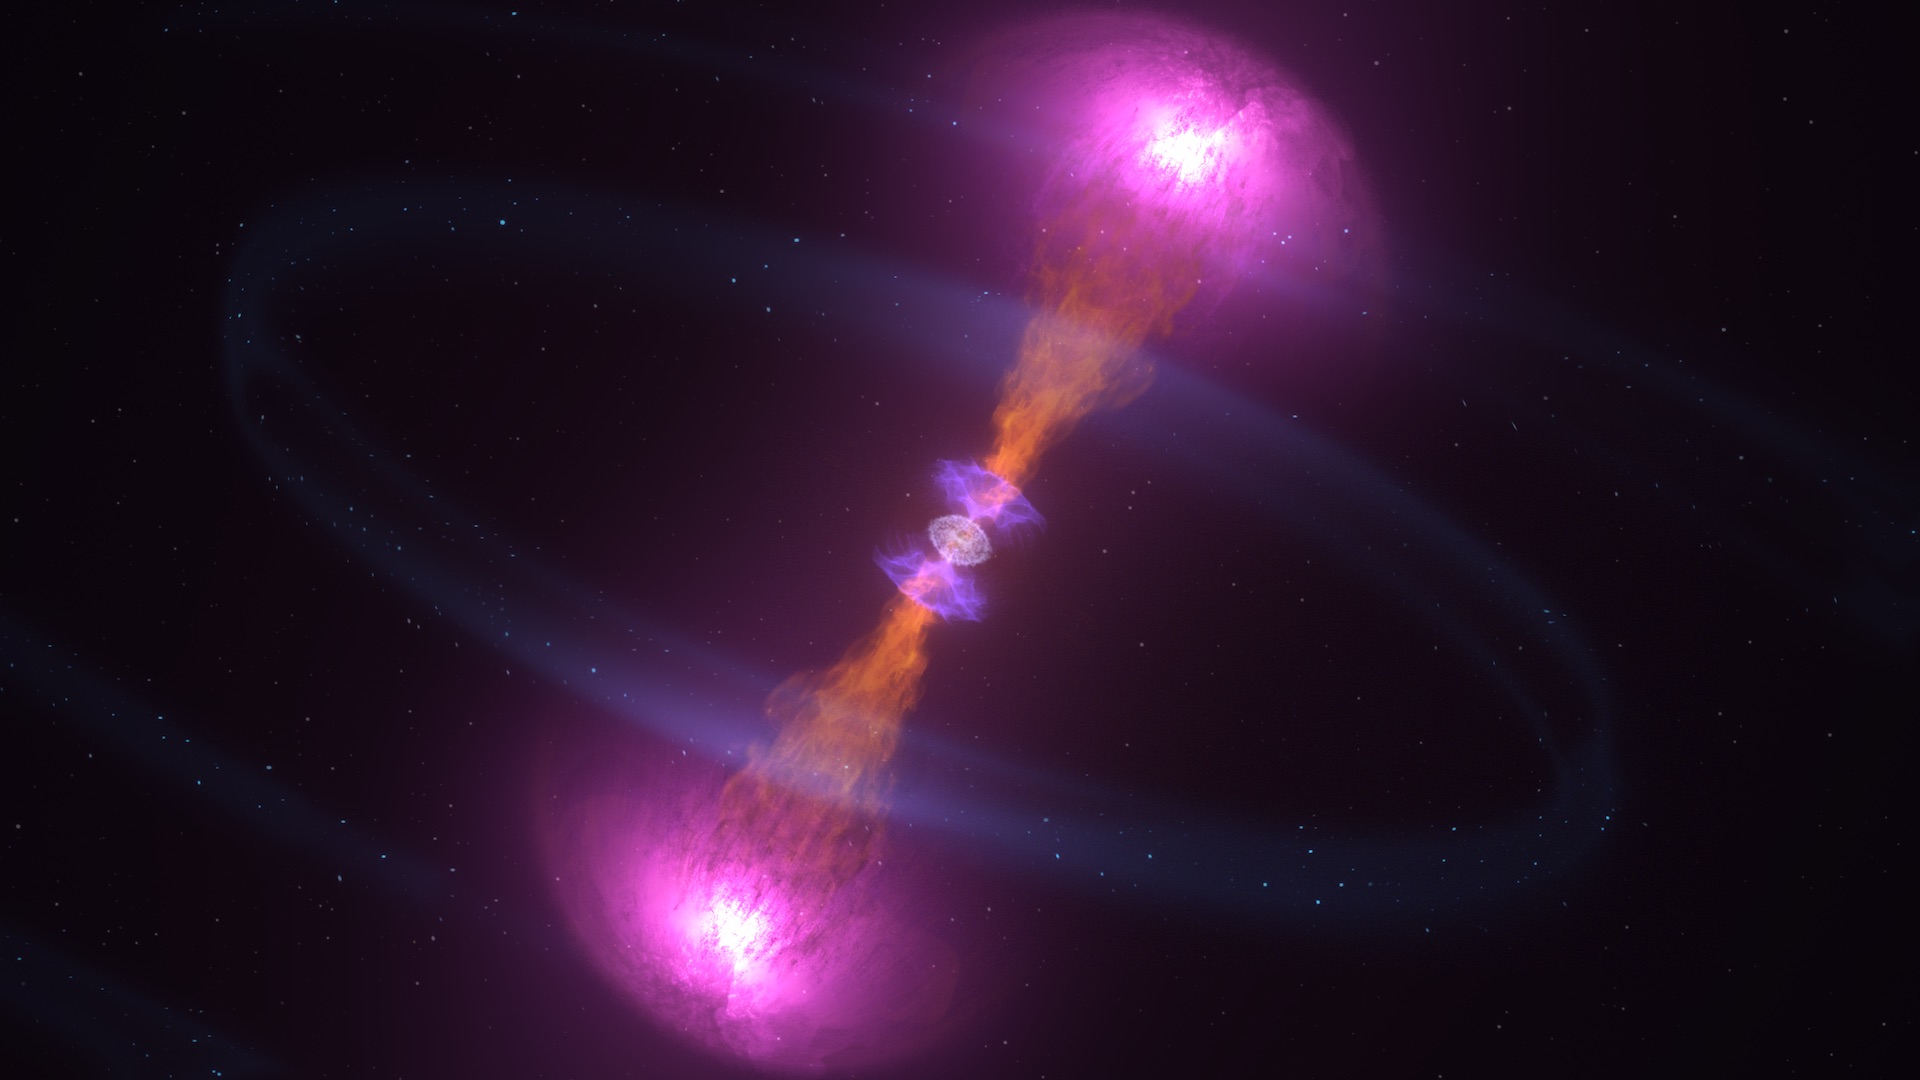
 and then expanding shock waves where the jets plow into surrounding material (pink structures at the tip of each jet). The animation then shows the kilonova (blue), which contains neutron-rich debris and glows due to the decay of newly forged radioactive elements. Credit: NASA's Goddard Space Flight Center/CI Lab")
This animation shows the explosive merging of two neutron stars, immediately followed by the eruption of powerful jets (orange) and then expanding shock waves where the jets plow into surrounding material (pink structures at the tip of each jet). The animation then shows the kilonova (blue), which contains neutron-rich debris and glows due to the decay of newly forged radioactive elements.
Credit: NASA's Goddard Space Flight Center/CI Lab
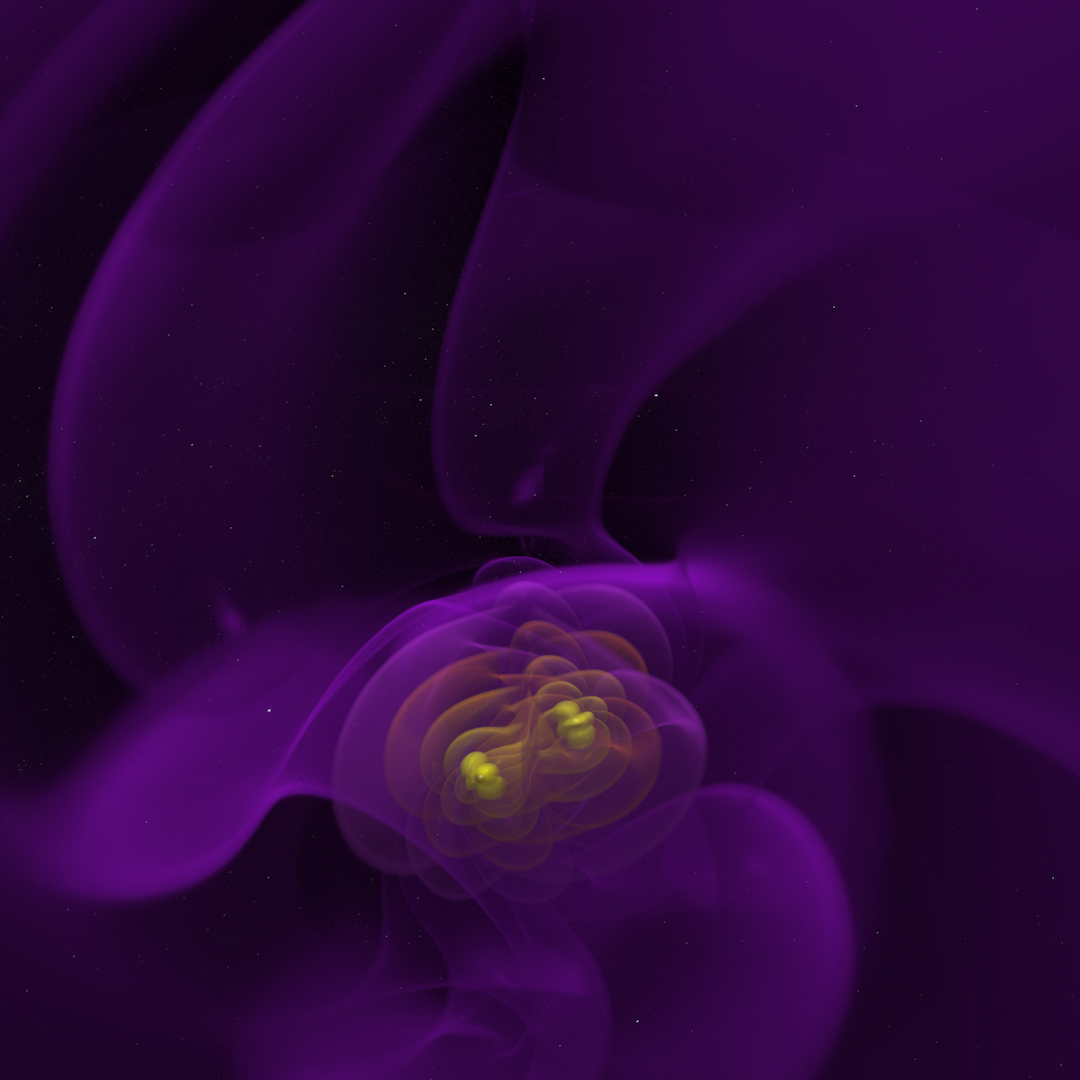
 of nearly equal mass as they spiral together and merge. Yellow structures near the black holes illustrate the strong curvature of space-time in the region. Orange ripples represent distortions of space-time caused by the rapidly orbiting masses. These distortions spread out and weaken, ultimately becoming gravitational waves (purple). The merger timescale depends on the masses of the black holes. For a system containing black holes with about 30 times the sun’s mass, similar to the one detected by LIGO in 2015, the orbital period at the start of the movie is just 65 milliseconds, with the black holes moving at about 15 percent the speed of light. Space-time distortions radiate away orbital energy and cause the binary to contract quickly. As the two black holes near each other, they merge into a single black hole that settles into its \"ringdown\" phase, where the final gravitational waves are emitted. For the 2015 LIGO detection, these events played out in little more than a quarter of a second. This simulation was performed on the Pleiades supercomputer at NASA's Ames Research Center. Credit: NASA/Bernard J. Kelly (Goddard and Univ. of Maryland Baltimore County), Chris Henze (Ames) and Tim Sandstrom (CSC Government Solutions LLC)")
This visualization shows gravitational waves emitted by two black holes (black spheres) of nearly equal mass as they spiral together and merge. Yellow structures near the black holes illustrate the strong curvature of space-time in the region. Orange ripples represent distortions of space-time caused by the rapidly orbiting masses. These distortions spread out and weaken, ultimately becoming gravitational waves (purple). The merger timescale depends on the masses of the black holes. For a system containing black holes with about 30 times the sun’s mass, similar to the one detected by LIGO in 2015, the orbital period at the start of the movie is just 65 milliseconds, with the black holes moving at about 15 percent the speed of light. Space-time distortions radiate away orbital energy and cause the binary to contract quickly. As the two black holes near each other, they merge into a single black hole that settles into its "ringdown" phase, where the final gravitational waves are emitted. For the 2015 LIGO detection, these events played out in little more than a quarter of a second. This simulation was performed on the Pleiades supercomputer at NASA's Ames Research Center.
Credit: NASA/Bernard J. Kelly (Goddard and Univ. of Maryland Baltimore County), Chris Henze (Ames) and Tim Sandstrom (CSC Government Solutions LLC)

Illustration of a black hole outburst. Sometimes an accretion disk flips into an unstable state that causes a greater flow of matter toward the black hole.
Credit: NASA/Goddard Space Flight Center/Conceptual Image Lab

Gas glows brightly in this computer simulation of supermassive black holes only 40 orbits from merging. Models like this may eventually help scientists pinpoint real examples of these powerful binary systems. This animated GIF rotates a frozen version of the simulation through 360 degrees as viewed from the plane of the disk.
Credit: NASA’s Goddard Space Flight Center
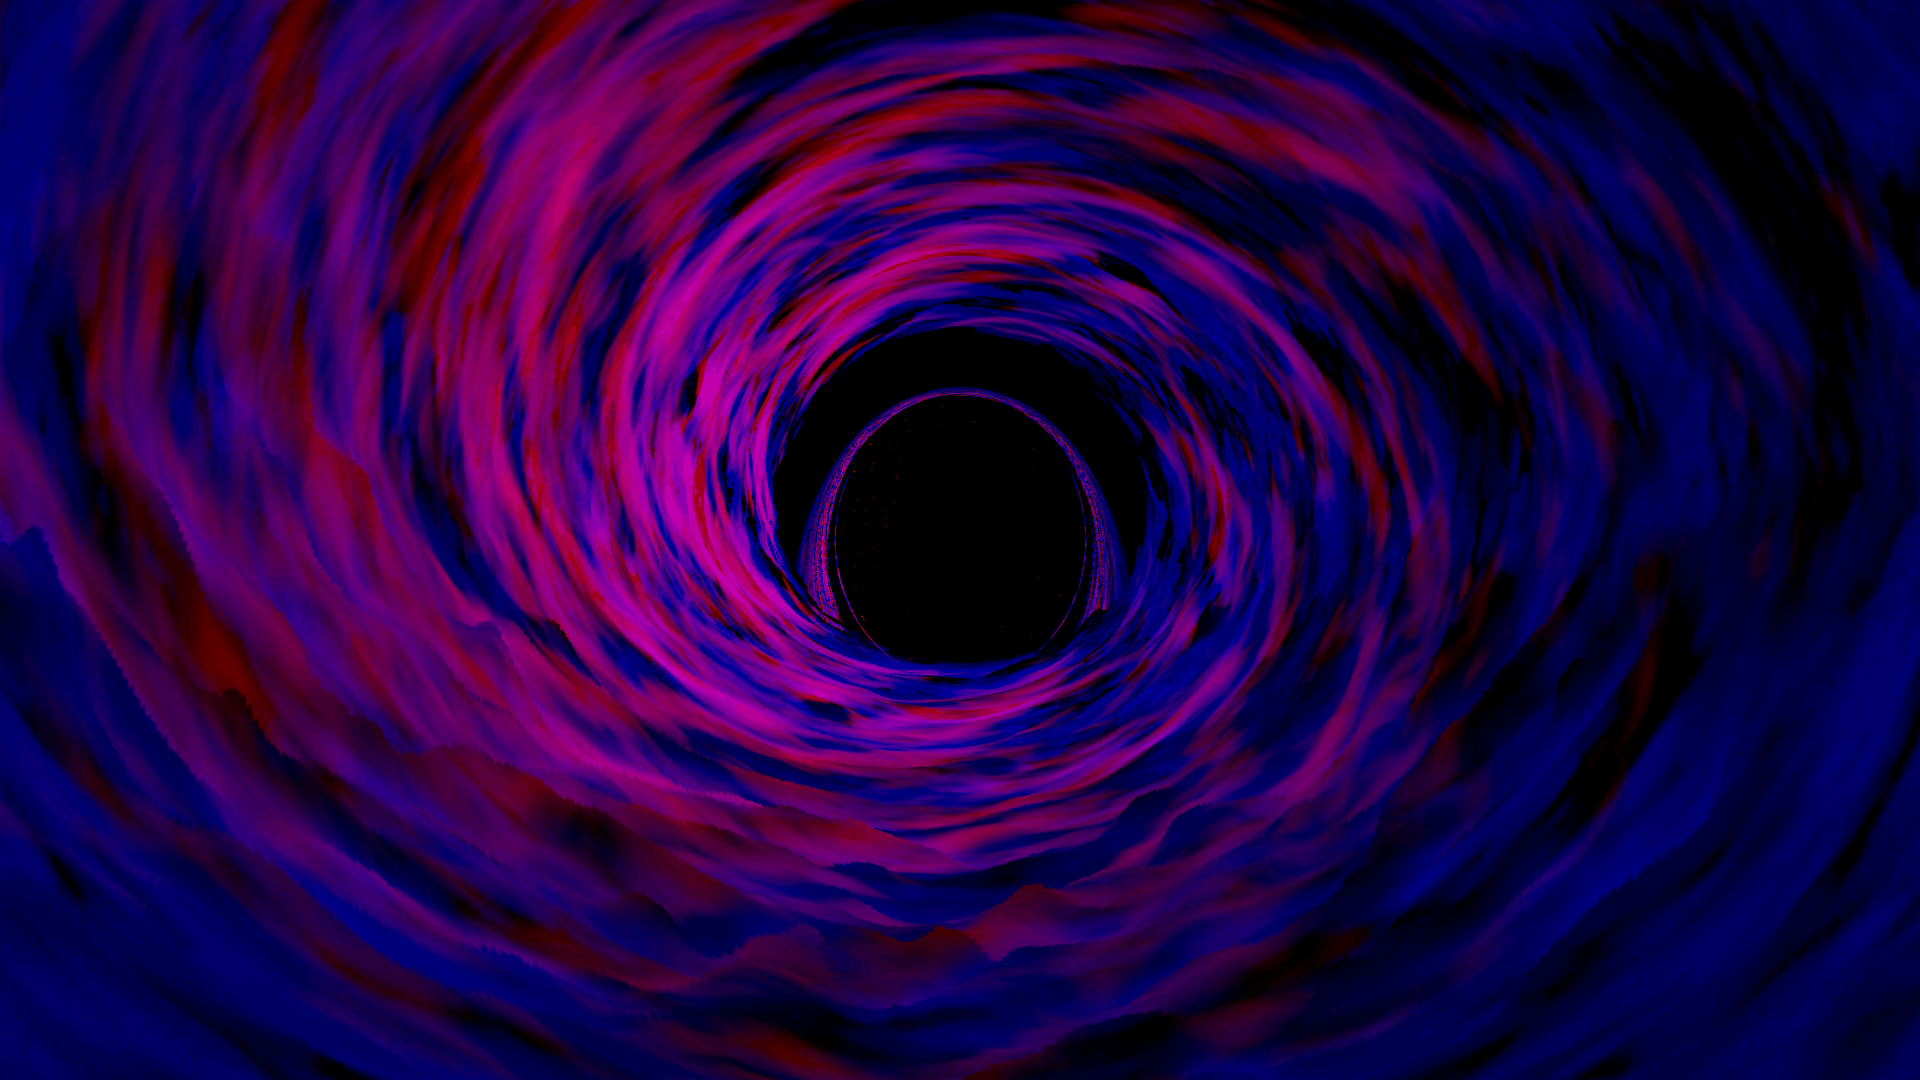
 apart with an orbital period of 46 minutes. The simulation shows how the black holes distort the starry background and capture light, producing black hole silhouettes. A distinctive feature called a photon ring outlines the black holes. The entire system has a mass about 1 million times the Sun’s.Credit: NASA’s Goddard Space Flight Center; background, ESA/Gaia/DPAC")
This video shows what the view might be like between two circling supermassive black holes around 18.6 million miles (30 million kilometers) apart with an orbital period of 46 minutes. The simulation shows how the black holes distort the starry background and capture light, producing black hole silhouettes. A distinctive feature called a photon ring outlines the black holes. The entire system has a mass about 1 million times the Sun’s.
Credit: NASA’s Goddard Space Flight Center; background, ESA/Gaia/DPAC
")
Illustration of a star exploding in a supernova and leaving behind an expanding shell of hot gas known as a supernova remnant.
Credit: ESA/Hubble (L. Calçada)
 from the inner accretion disk and high-energy X-rays (blue) from the inner corona of a stellar-mass black hole. Particles in the corona scatter soft X-rays from the disk and give them an energy boost, resulting in hard X-ray emission. We view the scene from a perspective 45 degrees above the plane of the accretion disk.Credit: NASA's Goddard Space Flight Center/J. Schnittman, J. Krolik (JHU) and S. Noble (RIT)")
This animation of supercomputer data shows both low-energy X-rays (red) from the inner accretion disk and high-energy X-rays (blue) from the inner corona of a stellar-mass black hole. Particles in the corona scatter soft X-rays from the disk and give them an energy boost, resulting in hard X-ray emission. We view the scene from a perspective 45 degrees above the plane of the accretion disk.
Credit: NASA's Goddard Space Flight Center/J. Schnittman, J. Krolik (JHU) and S. Noble (RIT)
")
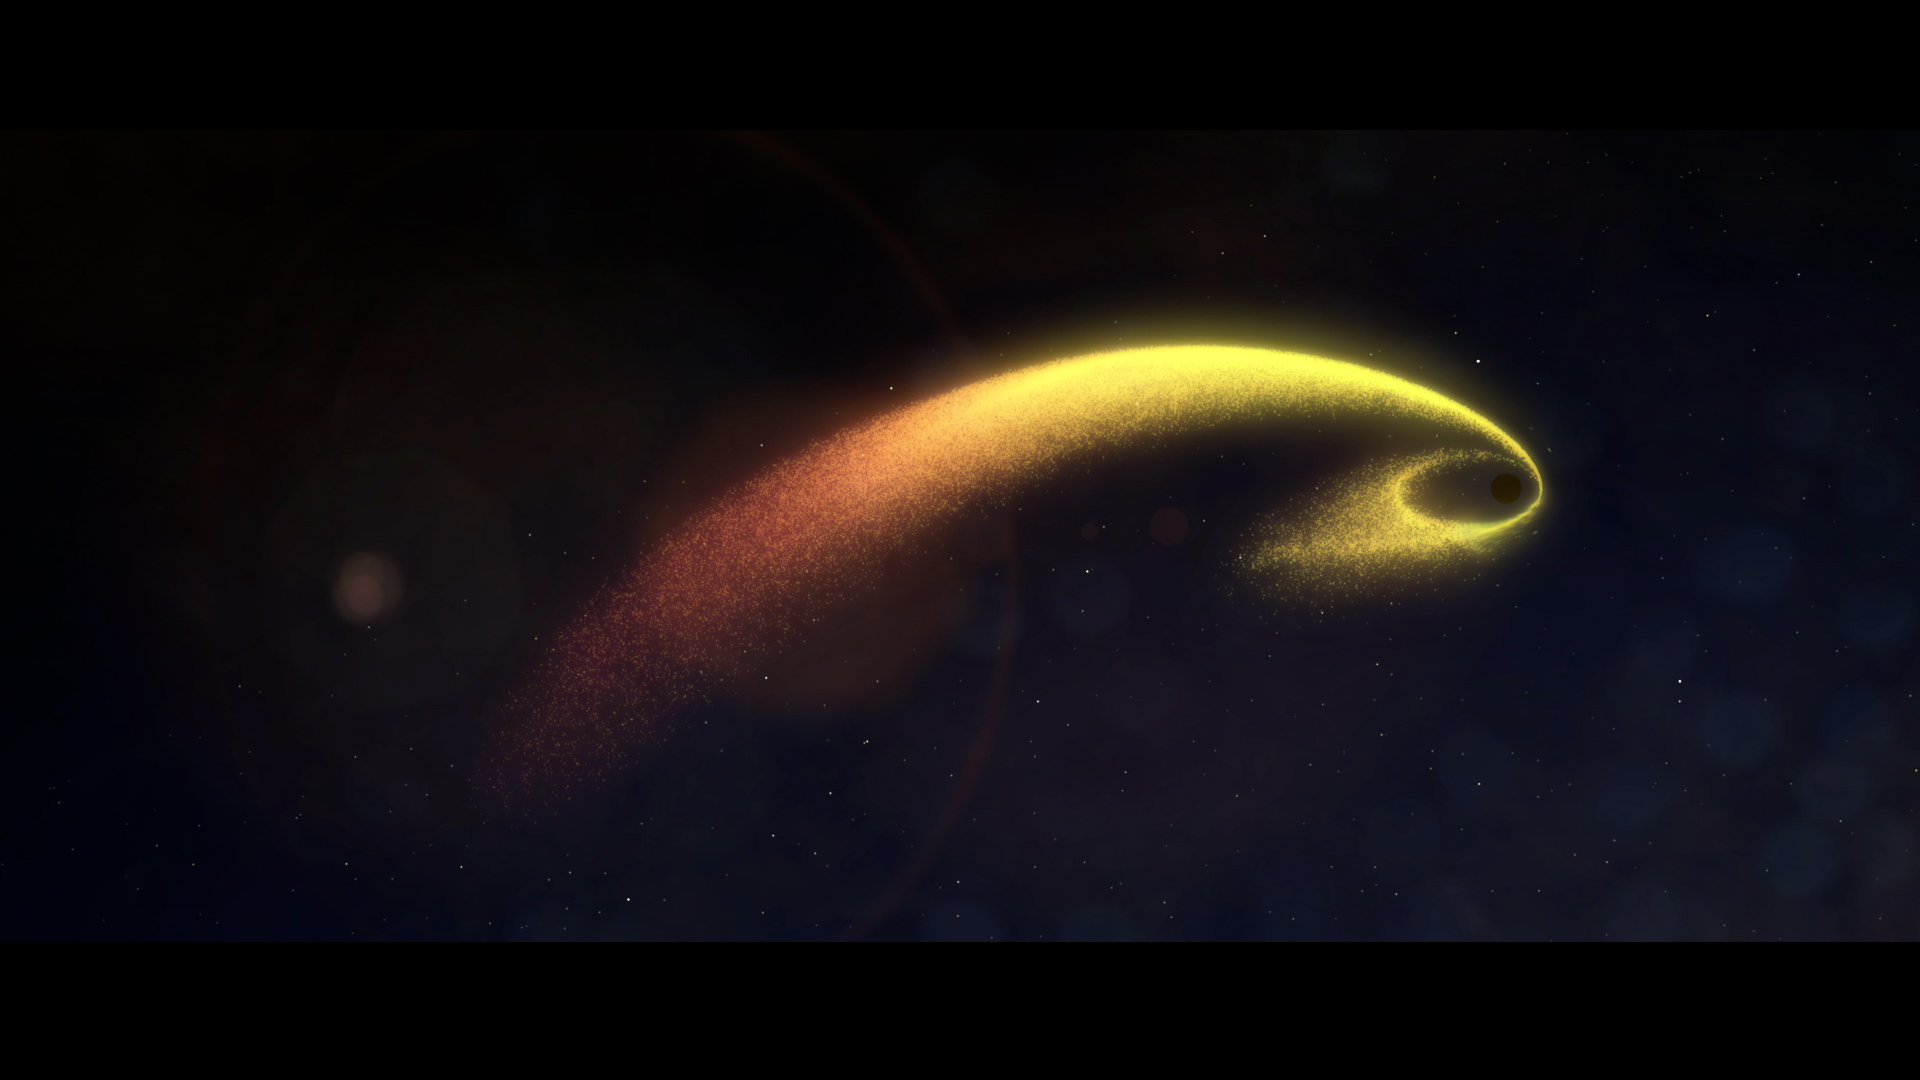
This animation illustrates what happens when an unlucky star strays too close to a monster black hole. Gravitational forces create intense tides that break the star apart into a stream of gas. The trailing part of the stream escapes the system, while the leading part swings back around, surrounding the black hole with a disk of debris. This cataclysmic phenomenon is called a tidal disruption event.
Credit: NASA’s Goddard Space Flight Center/Chris Smith (USRA/GESTAR)
")
This animation illustrates what happens when an unlucky star strays too close to a monster black hole. Gravitational forces create intense tides that break the star apart into a stream of gas. The trailing part of the stream escapes the system, while the leading part swings back around, surrounding the black hole with a disk of debris. A powerful jet can also form. This cataclysmic phenomenon is called a tidal disruption event.
Credit: NASA’s Goddard Space Flight Center/Chris Smith (USRA/GESTAR)
Credits
Please give credit for this item to:
NASA's Goddard Space Flight Center. However, individual items should be credited as indicated above.
-
Producers
- Barb Mattson (University of Maryland College Park)
- Sara Mitchell (University of Maryland College Park)
- Kelly Ramos (Business Integra)
-
Support
- Scott Wiessinger (KBR Wyle Services, LLC)
Series
This page can be found in the following series:Related
- ID: 13831
- ID: 13805
 Produced Video
 - ID: 13197
- ID: 12854
 Produced Video
 - ID: 13043
- ID: 12740
- ID: 11894
 Produced Video
 - ID: 11206
 Produced Video
 - ID: 11110
 Produced Video
Release date
This page was originally published on Tuesday, April 12, 2022.
This page was last updated on Wednesday, May 3, 2023 at 11:44 AM EDT.