A newer version of this visualization is available.
TESS Northern and Southern Mosaics
 was completed in July 2019, and the northern imaging was completed in July 2020. The prominent glowing band is the Milky Way, our galaxy seen edgewise. The ecliptic – the plane of Earth's orbit and the apparent yearly path of the Sun through the stars – runs straight across the middle of the map. Credit: NASA/MIT/TESS and Ethan Kruse (USRA)")
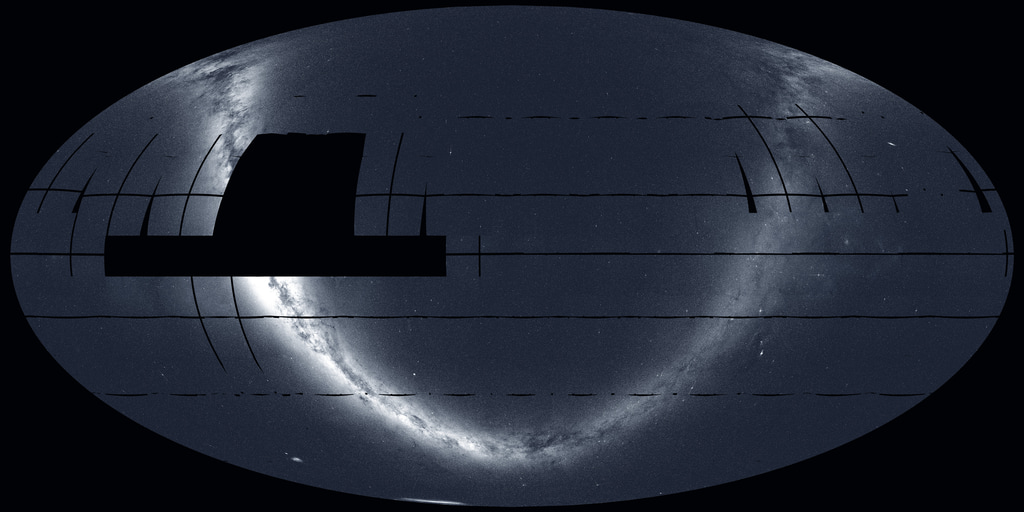
This plot combines the TESS northern and southern mosaics to show the extent of its primary mission survey. The yearlong southern panorama (bottom) was completed in July 2019, and the northern imaging was completed in July 2020. The prominent glowing band is the Milky Way, our galaxy seen edgewise. The ecliptic – the plane of Earth's orbit and the apparent yearly path of the Sun through the stars – runs straight across the middle of the map.
Credit: NASA/MIT/TESS and Ethan Kruse (USRA)
NASA's Transiting Exoplanet Survey Satellite (TESS) completed its two-year-long primary mission, during which it imaged about 75% of the sky, in July 2020. The southern panorama was completed in July 2019, while imaging for the northern survey took place over the following year. For about half of the northern sectors, the TESS team decided to angle the cameras further north to minimize the impact of scattered light from Earth and the Moon, resulting in a prominent gap in sky coverage.
This animated all-sky map shows how the 416 images in the TESS northern and southern mosaics fit together. The images of each sector appear in the order TESS captured them. In this plot, the ecliptic – the plane of Earth's orbit and the apparent yearly path of the Sun through the stars – runs straight across the middle of the map.
Credit: NASA/MIT/TESS and Ethan Kruse (USRA)
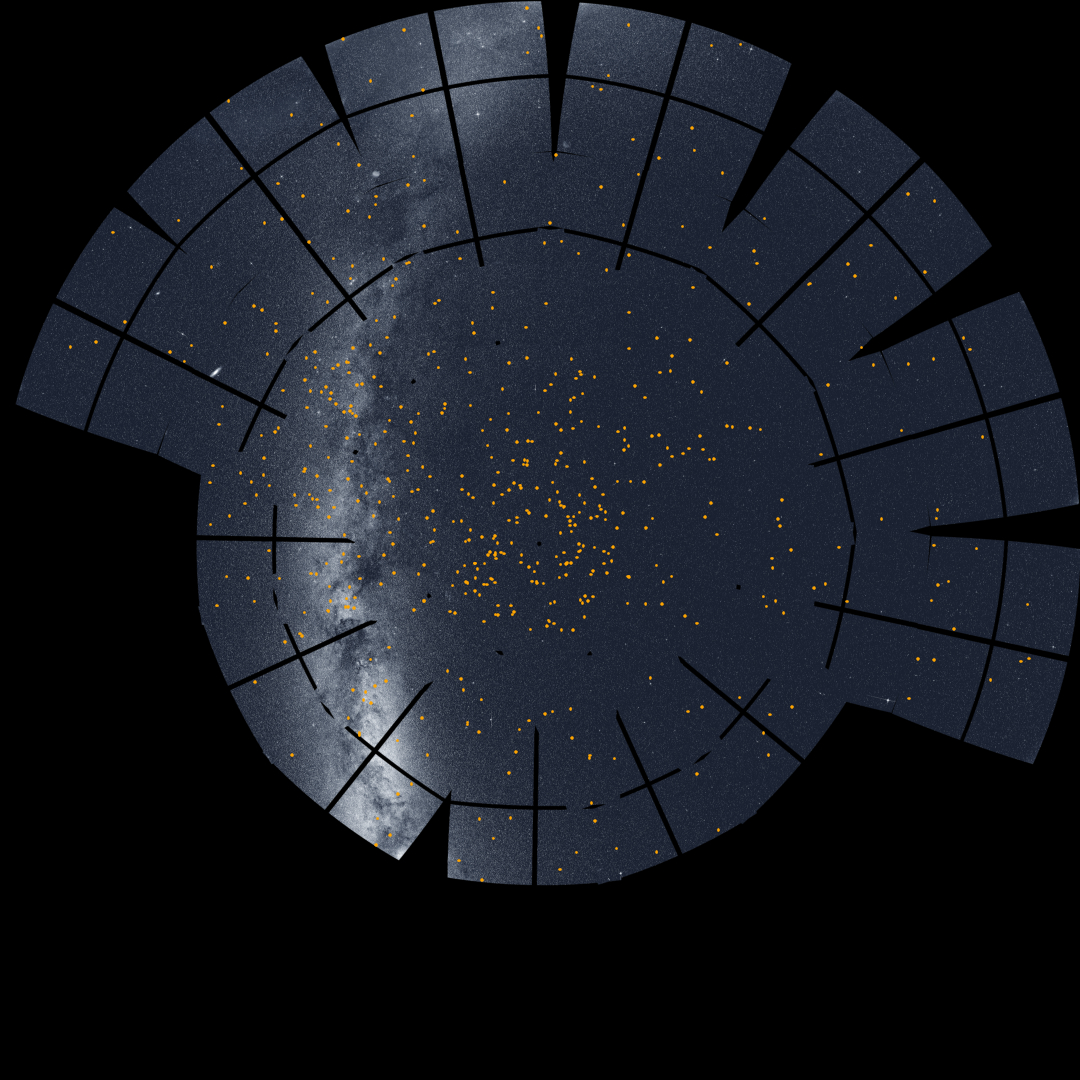
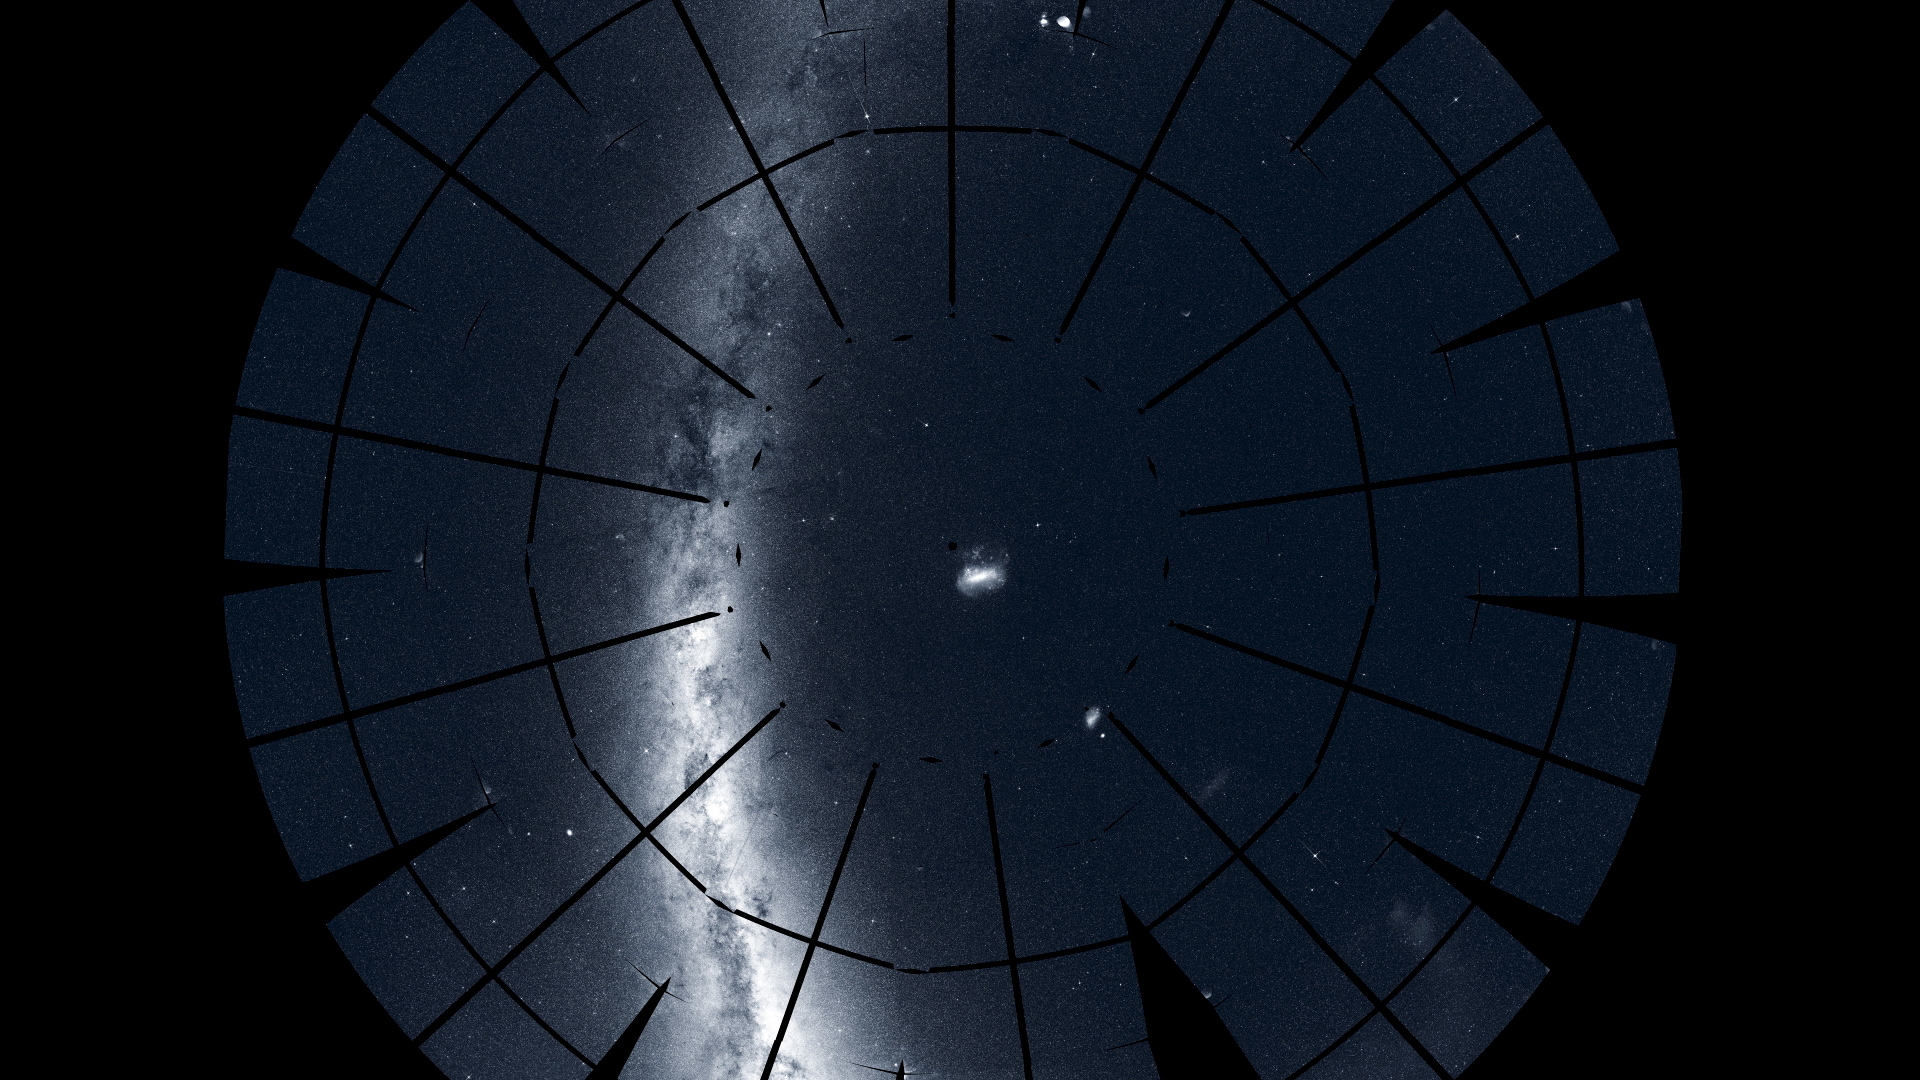
TESS's two yearlong panoramas appear side by side in twin polar views centered on the southern (left) and northern ecliptic poles. The prominent glowing band of the Milky Way – our galaxy seen edgewise – sweeps across both vistas.
Credit: NASA/MIT/TESS and Ethan Kruse (USRA)
Credits
Please give credit for this item to:
NASA's Goddard Space Flight Center. However, individual items should be credited as indicated above.
-
Producer
- Scott Wiessinger (USRA)
-
Science writer
- Francis Reddy (University of Maryland College Park)
-
Data visualizer
- Ethan Kruse (University of Maryland College Park)
-
Public affairs officer
- Claire Andreoli (NASA/GSFC)
Missions
This page is related to the following missions:Series
This page can be found in the following series:Related
- ID: 13710
 Produced Video
 - ID: 13285
 Produced Video
Newer Versions
- ID: 14265
 Produced Video
Release date
This page was originally published on Monday, October 5, 2020.
This page was last updated on Friday, October 6, 2023 at 3:23 PM EDT.