The Solar Cycle As Seen From Space
VIDEO IN ENGLISH
Watch this video on the NASA Goddard YouTube channel.
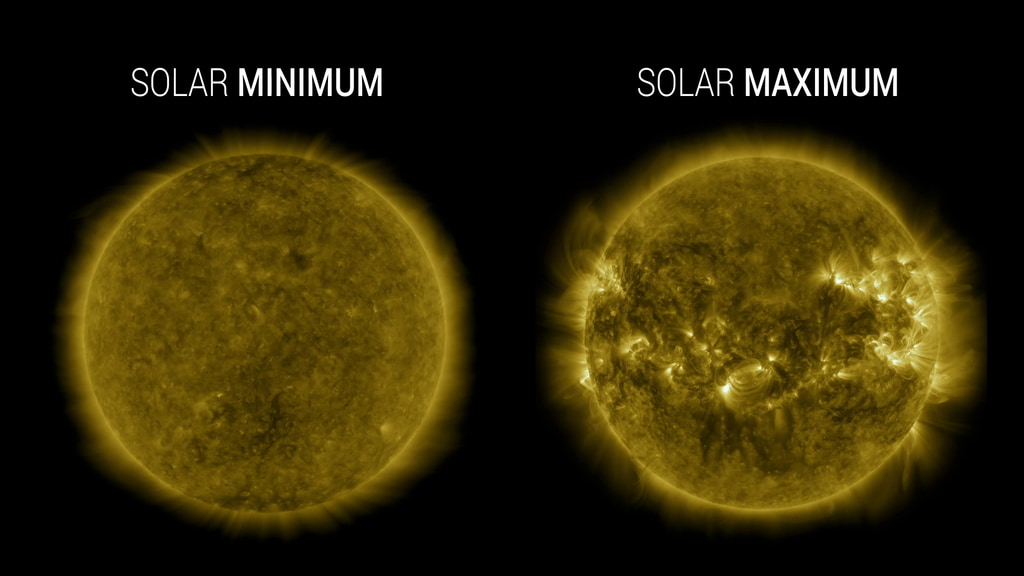
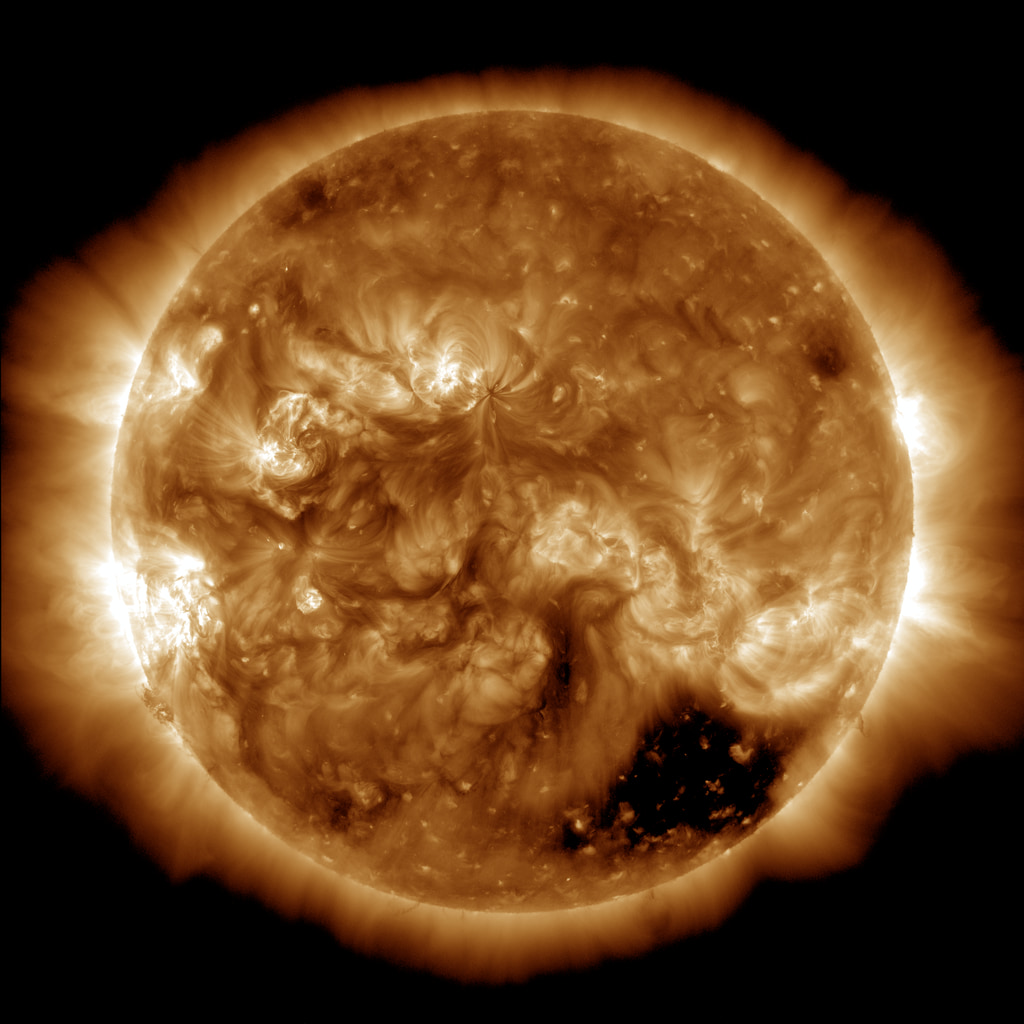
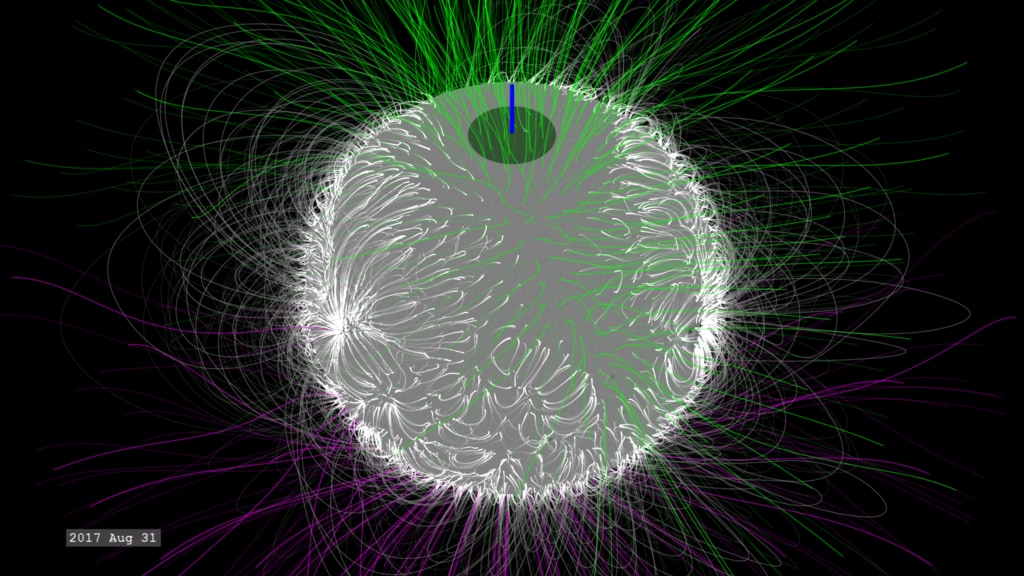
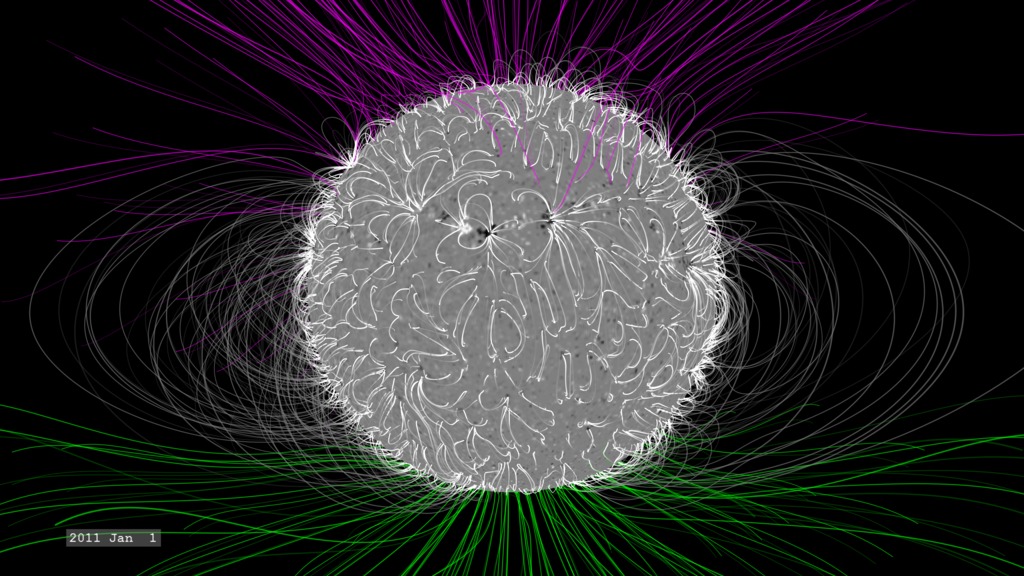
The Sun is stirring from its latest slumber. As sunspots and flares, signs of a new solar cycle, bubble from the Sun’s surface, scientists are anticipating a flurry of solar activity over the next few years. Roughly every 11 years, at the height of this cycle, the Sun’s magnetic poles flip—on Earth, that’d be like the North and South Poles’ swapping places every decade—and the Sun transitions from sluggish to active and stormy. At its quietest, the Sun is at solar minimum; during solar maximum, the Sun blazes with bright flares and solar eruptions. In this video, view the Sun's disk from our space telescopes as it transitions from minimum to maximum in the solar cycle.
Music credit: "Observance" by Andrew Michael Britton [PRS], David Stephen Goldsmith [PRS] from Universal Production Music
VIDEO EN ESPAÑOL
Mira este video en el canal NASA en Español en YouTube.
El ciclo solar visto desde el espacio
El Sol se está despertando de su último sueño. A medida que las manchas y las fulguraciones solares, señales de un nuevo ciclo solar, burbujean en la superficie del Sol, los científicos anticipan una oleada de actividad solar durante los próximos años. Aproximadamente cada 11 años, en el punto álgido de este ciclo, los polos magnéticos del Sol se desplazan — en la Tierra sería como si se diera un intercambio de los polos norte y sur cada década — y el Sol pasa de estar aletargado a activo y tormentoso. En su momento más tranquilo, el Sol se encuentra en el mínimo solar; durante el máximo solar, el Sol brilla con fulguraciones brillantes y erupciones solares. En este video, observa el disco del Sol visto mediante nuestros telescopios espaciales a medida que pasa del mínimo al máximo en el ciclo solar.
Crédito de música: "Observance" por Andrew Michael Britton [PRS], David Stephen Goldsmith [PRS] de Universal Production Music
Credits
Please give credit for this item to:
NASA's Goddard Space Flight Center
-
Producer
- Joy Ng (KBR Wyle Services, LLC)
-
Data visualizer
- Tom Bridgman (Global Science and Technology, Inc.)
-
Support
- Maria-Jose Vinas Garcia (Telophase)
- Pedro Cota (ADNET Systems, Inc.)
Missions
This page is related to the following missions:Related
- ID: 14685
![16:9 Landscape Version with HBY Logo and NASA MeatballMusic Credit: “Society News Bed Instrumental” by Jean-Francois Berger [SACEM] via Universal Production Music](/vis/a010000/a014600/a014685/thumbnail_design.png) Produced Video
Produced Video - ID: 14683

- ID: 13714
- ID: 13715
![Watch this video on the NASA Goddard YouTube channel.Complete transcript available.Music credits: “Infinite” by Joseph Pincus [ASCAP]; “Reflective Sensations”, “Ideas For Tomorrow”, “Think Tank” by Laurent Dury [SACEM]; “Wonderful Orbit” by Tom Furse Fairfax Cowan [PRS]](/vis/a010000/a013700/a013715/13715_TrackSolarCycle_YouTube.00284_print.jpg) Produced Video
Produced Video - ID: 13706
 Produced Video
Sources
- ID: 4854
 Visualization
 - ID: 4788
 Visualization
 - ID: 4391
 Visualization
Used as a Source In
- ID: 13814
 Produced Video
Release date
This page was originally published on Thursday, September 17, 2020.
This page was last updated on Wednesday, May 3, 2023 at 1:44 PM EDT.