The Solar Polar Magnetic Field
From our single vantage point of Earth, our view of the Sun is never complete. While the far-side of the Sun eventually rotates into view, coverage of the Sun's polar regions is never satisfactory as perspective effects either completely block our view or create a distorted view. We must often resort to computer modeling of these solar polar regions.
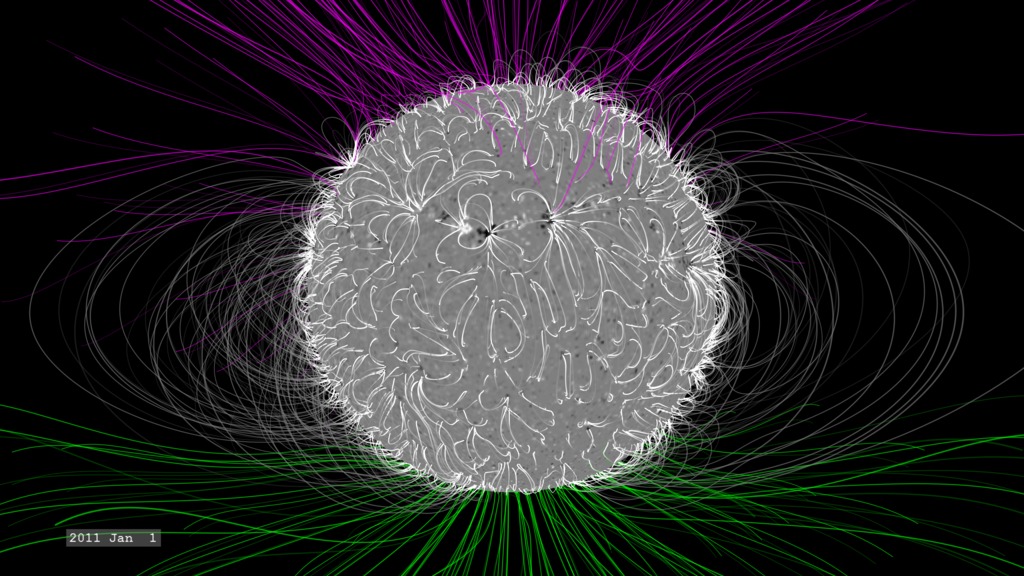
This visualization presents the Potential Field Source Surface (PFSS) magnetic field model based on solar observations covering the years 2017-2019. One version also presents the 'hole' in our measurements of the solar polar region. The region oscillates in size over the course of the year due to the changing perspective created by the tilt of Earth's orbital plane with the solar equator. In this region, researchers must resort to approximations to build a more complete view of the solar magnetic field.
Why is the solar magnetic field in this region important? Because the combined with the outgoing flow of the solar wind, the magnetic field lines from the polar regions curve up, and then back down to near the Sun's equatorial plane, which is still fairly close to the orbital plane of Earth and other planets in our solar system. This gives the Sun's polar magnetic field a significant influence on the space weather impacting Earth and crewed and uncrewed assets around the solar system.
This movie gives a view starting at equator and tipping to a view of the north heliographic pole (the blue axis) then dipping down to the south heliographic pole. Closed field lines are white/grey, green and violet lines represent field lines that are considered 'open'. Green represents positive magnetic polarity, and violet represents negative polarity. The dark rings around the blue polar axis show the region where the solar surface magnetic field must be generated from a model. This region grows and shrinks depending on SDOs position in its orbit around the Sun and Earth (above and below the solar equator, which is tilted by 7.25 degrees relative to Earth's orbital plane).
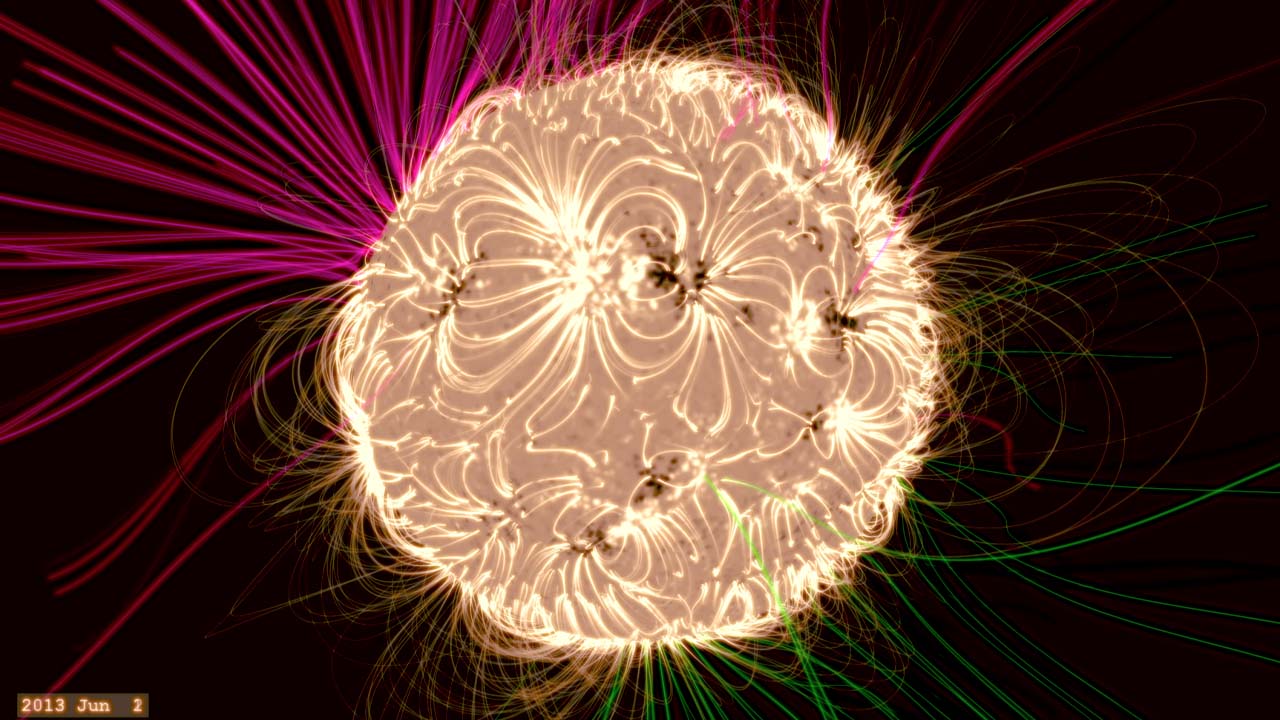
This movie has a view (roughly) from the position of SDO. The polar gap rings are not shown on these.
This movie has a view a fixed solar longitude so the Sun does not appear to rotate. The polar gap rings are not shown on these.
Credits
Please give credit for this item to:
NASA's Scientific Visualization Studio
-
Visualizer
- Tom Bridgman (Global Science and Technology, Inc.)
-
Scientists
- Chris St. Cyr (NASA/GSFC)
- William D. Pesnell (NASA/GSFC)
-
Producer
- Genna Duberstein (ADNET Systems, Inc.)
-
Writer
- Joy Ng (USRA)
-
Technical support
- Laurence Schuler (ADNET Systems, Inc.)
- Ian Jones (ADNET Systems, Inc.)
Release date
This page was originally published on Tuesday, February 4, 2020.
This page was last updated on Wednesday, May 3, 2023 at 1:45 PM EDT.
Missions
This visualization is related to the following missions:Datasets used in this visualization
-
PFSS (Magnetic Field Lines) [PFSS]
ID: 409This model generated from SOHO/MDI magnetograms through the SolarSoft package.
This dataset can be found at: http://sohowww.nascom.nasa.gov/solarsoft/
See all pages that use this dataset
Note: While we identify the data sets used in these visualizations, we do not store any further details, nor the data sets themselves on our site.
Related
- ID: 13535
 Produced Video
 - ID: 13527
![VideoWatch this video on the NASA Goddard YouTube channel.Music credits: “Oxide” and “Virtual Tidings” by Andrew Michael Britton [PRS], David Stephen Goldsmith [PRS]; “Progressive Practice” by Emmanuel David Lipszc [SACEM], Franck Lascombes [SACEM], Sebastien Lipszyc [SACEM]; “Political Spectrum” by Laurent Dury [SACEM} from Universal Production MusicComplete transcript available.](/vis/a010000/a013500/a013527/13537_SolarOrbiterOverview_YouTube.00725_print.jpg) Produced Video
Produced Video - ID: 4623
 Visualization
 - ID: 4391
 Visualization
 - ID: 12104
 Produced Video
Used as a Source In
- ID: 13716
![VIDEO IN ENGLISH Watch this video on the NASA Goddard YouTube channel.The Sun is stirring from its latest slumber. As sunspots and flares, signs of a new solar cycle, bubble from the Sun’s surface, scientists are anticipating a flurry of solar activity over the next few years. Roughly every 11 years, at the height of this cycle, the Sun’s magnetic poles flip—on Earth, that’d be like the North and South Poles’ swapping places every decade—and the Sun transitions from sluggish to active and stormy. At its quietest, the Sun is at solar minimum; during solar maximum, the Sun blazes with bright flares and solar eruptions. In this video, view the Sun's disk from our space telescopes as it transitions from minimum to maximum in the solar cycle.Music credit: "Observance" by Andrew Michael Britton [PRS], David Stephen Goldsmith [PRS] from Universal Production Music](/vis/a010000/a013700/a013716/13716_SolarCycleFromSpace_YouTube.01410_print.jpg) Produced Video
Produced Video