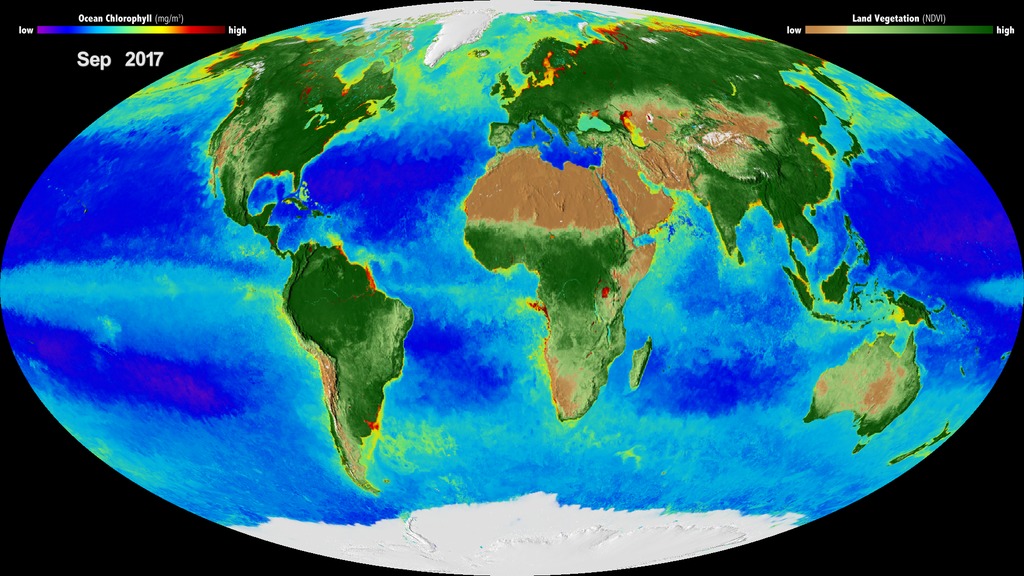
A Candid Look at NASA's "Living Planet"
Creating a major scientific visualization takes considerable time and expertise. A team of scientists and data visualizers work together to building an artful depiction of hard data - whether it be an animation of sea surface temperature, hurricane paths, or life on Planet Earth. Get a closer look at how the "Living Planet" visualization was created from the perspective of scientists Gene Feldman and Compton Tucker and SVS data visualizer, Alex Kekesi.
Music: Marimba Rhythms by Andrew Hamilton
Complete transcript available.
Coming soon to our YouTube channel.
Credits
Please give credit for this item to:
NASA's Goddard Space Flight Center
-
Producer
- LK Ward (USRA)
-
Scientists
- Gene Feldman (NASA/GSFC)
- Compton Tucker (NASA/GSFC)
-
Visualizer
-
Alex Kekesi
(Global Science and Technology, Inc.)

-
Alex Kekesi
(Global Science and Technology, Inc.)
-
Technical support
- Aaron E. Lepsch (ADNET Systems, Inc.)
Series
This page can be found in the following series:Used as a Source In
- ID: 4596
 Visualization
Release date
This page was originally published on Friday, February 9, 2018.
This page was last updated on Wednesday, May 3, 2023 at 1:46 PM EDT.