Science On a Sphere: A Global Tour of Precipitation from NASA
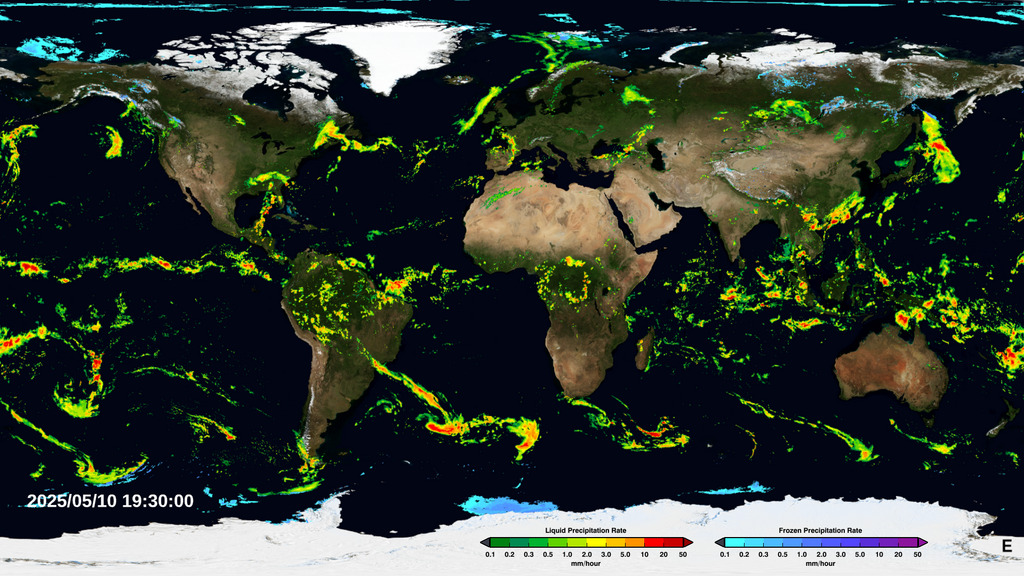
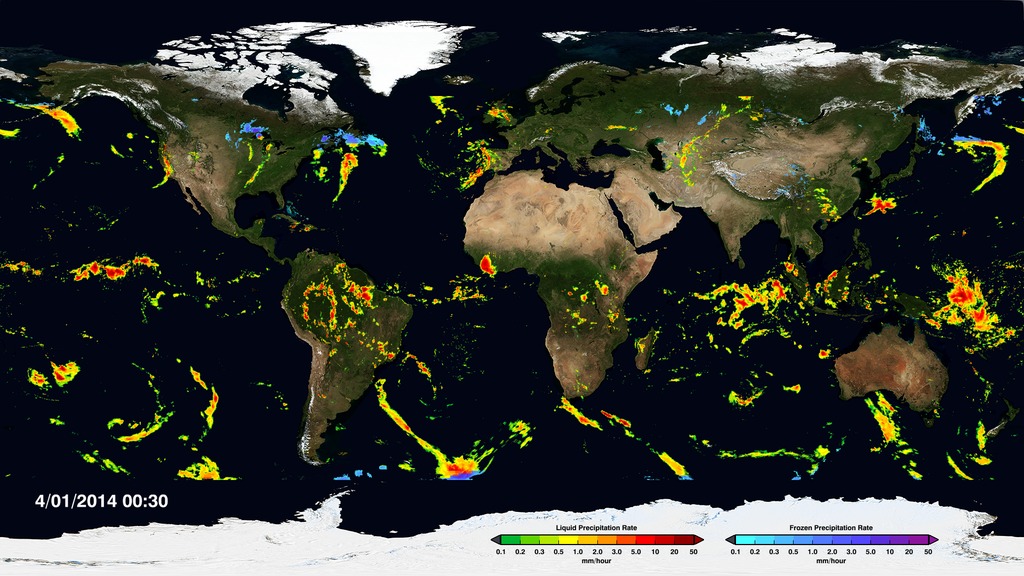
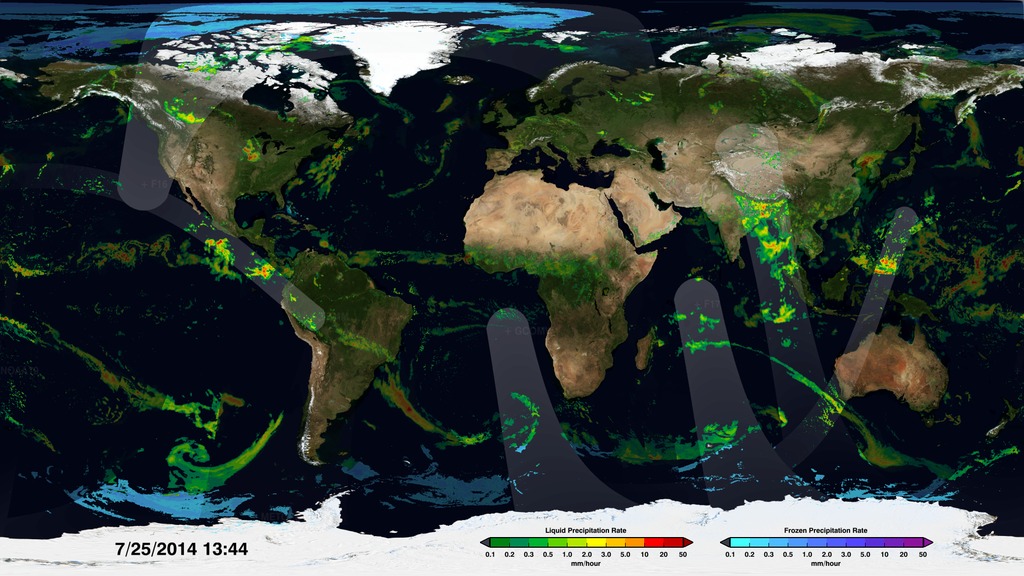
Precipitation (falling rain and snow) is our fresh water reservoir in the sky and is fundamental to life on Earth. A Global Tour of Precipitation from NASA shows how rain and snowfall moves around the world from the vantage of space using measurements from the Global Precipitation Measurement Core Observatory, or GPM. This is a joint mission between NASA and the Japanese Aerospace Exploration Agency (JAXA) and offers the most detailed and worldwide view of rain and snowfall ever created.
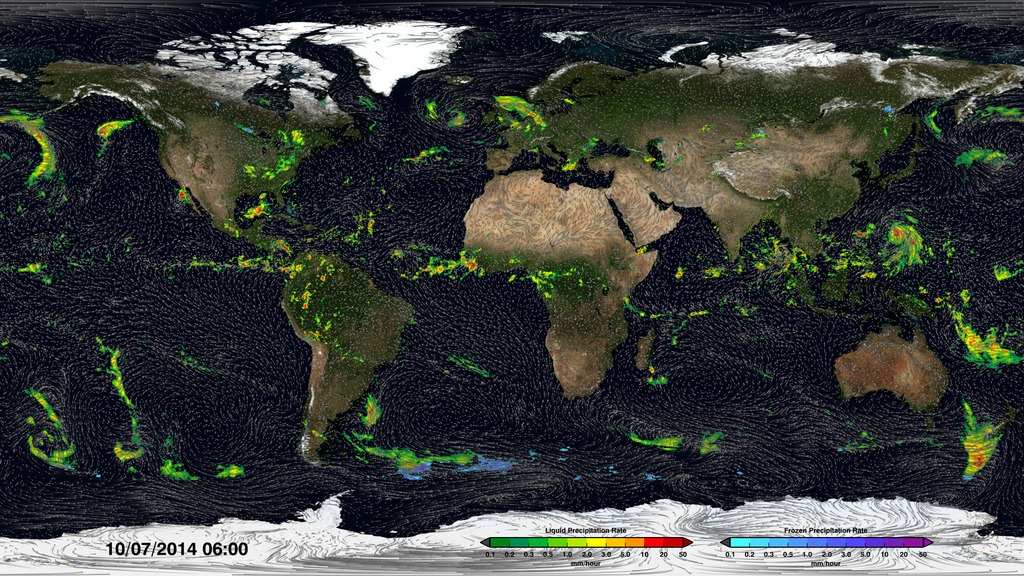
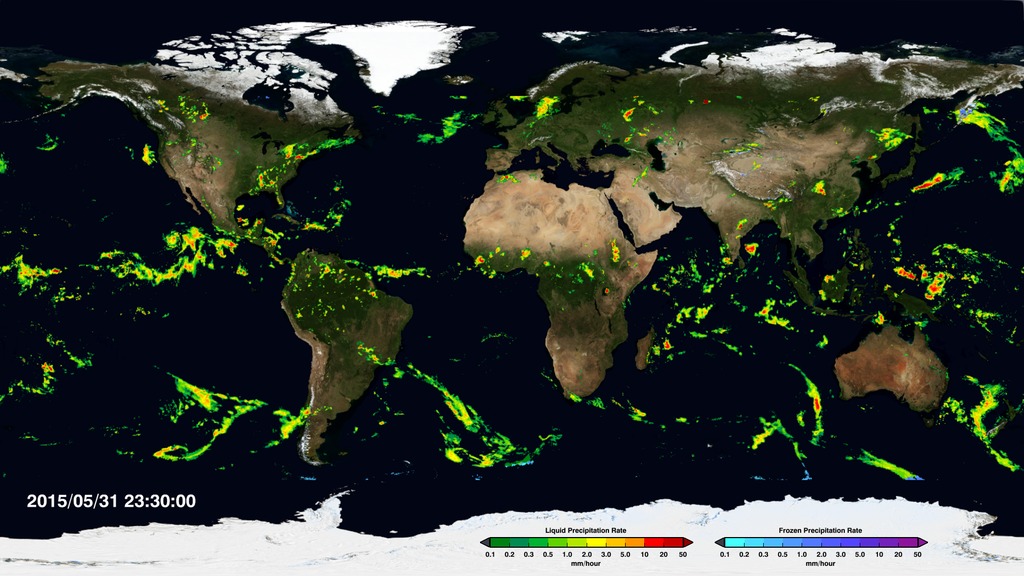
This narrated movie is created for Science On a Sphere, a platform designed by NOAA that displays movies on a spherical screen. Audiences can view the movie from any side of the sphere and can see any part of Earth. During this show viewers will be guided through a variety of precipitation patterns and display features such as the persistent band of the heaviest rainfall around the equator and tight swirls of tropical storms in the Northern Hemisphere. At subtropical latitudes in both hemispheres there are persistent dry areas and this is where most of the major deserts reside. Sea surface temperature and winds are also shown to highlight the interconnectedness of the Earth system. The movie concludes with near real-time global precipitation data from GPM, which is provided to Science On a Sphere roughly six hours after the observation.
To download this movie formatted for a spherical screen, visit NOAA's official Science On a Sphere website below:
• A Global Tour of Precipitation from NASA
• Near Real-Time Global Precipitation Data
This is an abridged 2-D version of A Global Tour of Precipitation in 4K that is designed for flat screens.
Complete transcript available.
Watch this video on the NASA Goddard YouTube channel.
Music credits: Tides by Ben Niblett and Jon Cotton, Developing Over Time by Ben Niblett and Jon Cotton. Both tracks are from the KillerTracks catalog.
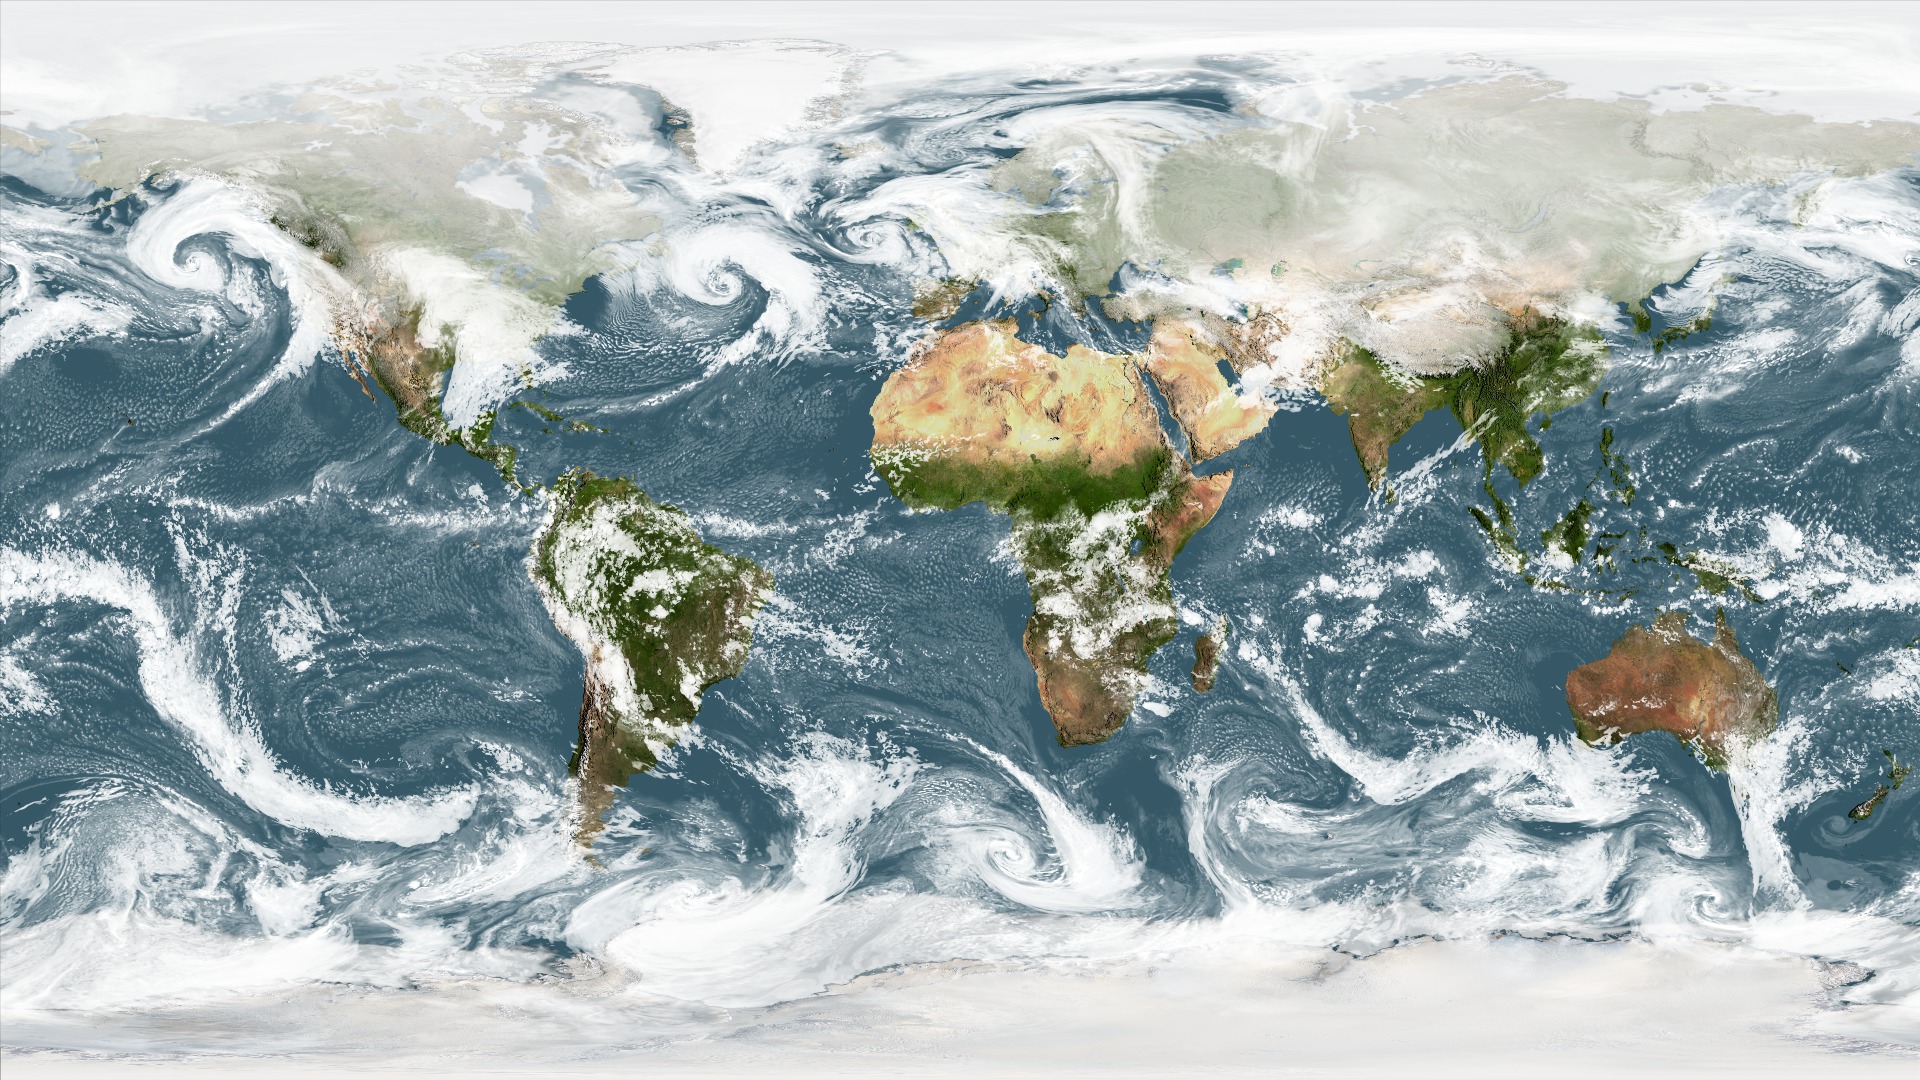
This visualization shows Multi-scale Ultra-high Resolution Sea Surface Temperature (MUR SST) data from June 1, 2014 to October 1, 2014.
More information on MUR SST can be found here.
This visualization combines MUR Sea Surface Temperature (SST) data with GPM's IMERG precipitation data and MERRA winds. Note, the time period within each dataset does not match.
This visualization combines MUR Sea Surface Temperature (SST) data with MERRA winds. Note, the time period within each dataset does not match.
This visualization combines MUR Sea Surface Temperature (SST) data with GPM's IMERG preciptation data. Note, the time period within each dataset does not match.
For More Information
See the following sources:
Credits
Please give credit for this item to:
NASA's Goddard Space Flight Center
-
Data visualizers
- Horace Mitchell (NASA/GSFC)
-
Greg Shirah
(NASA/GSFC)

-
Alex Kekesi
(Global Science and Technology, Inc.)
-
Scientists
- Gail Skofronick Jackson (NASA/GSFC)
-
George Huffman
(NASA/GSFC)
- Dalia B Kirschbaum (NASA/GSFC)
-
Producers
- Joy Ng (USRA)
- Ryan Fitzgibbons (USRA)
-
Editor
- Joy Ng (USRA)
-
Support
Series
This page can be found in the following series:Related
- ID: 13079
![This is a 360° video that can be downloaded and viewed on 360° video platforms such as YouTube and Facebook. Complete transcript available.Music credit: "The Answer" by Laurent Levesque [SACEM] from Killer Tracks](/vis/a010000/a013000/a013079/Inside_Hurricane_Maria_in_360.00001_print.jpg) Produced Video
Produced Video - ID: 4285
Older Versions
- ID: 4257
 Visualization
Sources
- ID: 4382
 Visualization
 - ID: 4372
 Visualization
 - ID: 4369
 Visualization
 - ID: 3723
Release date
This page was originally published on Monday, May 16, 2016.
This page was last updated on Tuesday, June 18, 2019 at 6:30 PM EDT.