Fermi Hyperwall--2016 AAS, A Walk Through Fermi Science

3x3 hyperwall-resolution image of the Fermi Gamma-ray Space Telescope with instruments labeled.
Credit: NASA/JIm Grossmann
For additional Fermi hyperwall visuals please check the second hyperwall page
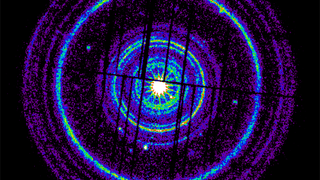
Gamma-ray bursts are the most luminous explosions in the cosmos. Astronomers think most occur when the core of a massive star runs out of nuclear fuel, collapses under its own weight, and forms a black hole, as illustrated in this animation. The black hole then drives jets of particles that drill all the way through the collapsing star at nearly the speed of light. These jets pierce through the star, emitting X-rays and gamma rays (magenta) as they stream into space. They then plow into material surrounding the doomed star and produce a multiwavelength afterglow that gradually fades away. The closer to head-on we view one of these jets, the brighter it appears.
Credit: NASA's Goddard Space Flight Center

Up-resed, UHD-resolution artist's conception of an active galactic nucleus.
Original animation: HERE
Credit: NASA's Goddard Space Flight Center/CI Lab
. During their journey, the number of randomly moving ultraviolet and optical photons (blue) increases as more and more stars are born in the universe. Eventually, one of the gamma rays encounters a photon of starlight and the gamma ray transforms into an electron and a positron. The remaining gamma-ray photons arrive at Fermi, interact with tungsten plates in the LAT, and produce the electrons and positrons whose paths through the detector allows astronomers to backtrack the gamma rays to their source.Original animation: HERECredit: NASA's Goddard Space Flight Center/Cruz deWilde")
Up-resed, UHD resolution artist's conception that tracks several gamma rays through space and time, from their emission in the jet of a distant blazar to their arrival in Fermi's Large Area Telescope (LAT). During their journey, the number of randomly moving ultraviolet and optical photons (blue) increases as more and more stars are born in the universe. Eventually, one of the gamma rays encounters a photon of starlight and the gamma ray transforms into an electron and a positron. The remaining gamma-ray photons arrive at Fermi, interact with tungsten plates in the LAT, and produce the electrons and positrons whose paths through the detector allows astronomers to backtrack the gamma rays to their source.
Original animation: HERE
Credit: NASA's Goddard Space Flight Center/Cruz deWilde
; MPIfR/ESO/APEX/A.Weiss et al. (microwave); NASA/CXC/CfA/R.Kraft et al. (X-ray); NASA/TANAMI/Müller et al. (jet)")
UHD-resolution sequence of the Centaurus A radio galaxy and a radio image of the central black hole's jet.
Original animation: HERE
Credit: ESO/WFI (visible); MPIfR/ESO/APEX/A.Weiss et al. (microwave); NASA/CXC/CfA/R.Kraft et al. (X-ray); NASA/TANAMI/Müller et al. (jet)
Composite image of Centaurus A in radio, optical and gamma-ray light.
Credit: Capella Observatory (optical), with radio data from Ilana Feain, Tim Cornwell, and Ron Ekers (CSIRO/ATNF), R. Morganti (ASTRON), and N. Junkes (MPIfR).
Various images of the Large Magellanic Cloud, a dwarf galaxy that houses several bright gamma-ray pulsars.
Credits, (clockwise from right):
NASA/JPL-Caltech/M. Meixner (STScI), the SAGE Legacy Team and NASA/DOE/Fermi LAT Collaboration
C. Smith, S. Points, the MCELS Team, NOAO/AURA/NSF and NASA/DOE/Fermi LAT Collaboration
NASA/DOE/Fermi LAT Collaboration
Axel Mellinger, Central Michigan University
3x3 hyperwall-resolution image of the Fermi bubbles.
Credit: NASA/DOE/Fermi LAT Collaboration
Illustrations of a white dwarf star going nova in a binary with a red giant, and a white dwarf star going nova in a more classic binary with a sun-like star.
Credit: NASA's Goddard Space Flight Center/S. Wiessinger

Up-resed, UHD-resolution illustration of a so-called "black widow" pulsar binary.
Original animation: HERE
Credit: NASA's Goddard Space Flight Center/Cruz deWilde

Up-resed, UHD-resolution illustration of a pulsar binary system that alternates between radio and gamma-ray emission.
Original animation: HERE
Credit: NASA's Goddard Space Flight Center/Cruz deWilde

Illustration of the "Fermi Bubbles," gamma-ray emitting lobes above and below the plane of the Milky Way.
Credit: NASA's Goddard Space Flight Center

This composite image of the Crab Nebula uses data from three of NASA's Great Observatories. The Chandra X-ray image is shown in blue, the Hubble Space Telescope optical image is in red and yellow, and the Spitzer Space Telescope's infrared image is in purple.Credit: X-ray: NASA/CXC/SAO/F.Seward; Optical: NASA/ESA/ASU/J.Hester & A.Loll; Infrared: NASA/JPL-Caltech/Univ. Minn./R.Gehrz
 and X-ray (blue) data reveals the jets and radio-emitting lobes emanating from Centaurus A's central black hole. Credit: ESO/WFI (visible); MPIfR/ESO/APEX/A.Weiss et al. (microwave); NASA/CXC/CfA/R.Kraft et al. (X-ray)")
This composite of visible, microwave (orange) and X-ray (blue) data reveals the jets and radio-emitting lobes emanating from Centaurus A's central black hole. Credit: ESO/WFI (visible); MPIfR/ESO/APEX/A.Weiss et al. (microwave); NASA/CXC/CfA/R.Kraft et al. (X-ray)

Illustration of a gamma-ray burst and jet.
Credit: NASA's Goddard Space Flight Center/Cruz deWilde
Credits
Please give credit for this item to:
NASA's Goddard Space Flight Center. However, individual items should be credited as indicated above.
-
Producer
- Scott Wiessinger (USRA)
Missions
This page is related to the following missions:Series
This page can be found in the following series:Related
- ID: 14317
- ID: 12101
 Produced Video
Release date
This page was originally published on Monday, January 4, 2016.
This page was last updated on Sunday, February 2, 2025 at 11:19 PM EST.