Fermi Hyperwall--2016 AAS Technical
Upresed 5760x3240 animation of the Fermi spacecraft.
Credit: NASA's Goddard Space Flight Center/CI Lab

3x3 Hyperwall-resolution graphic showing the atmosphere's transmission of the electromagnetic spectrum. This highlights why spacecraft are necessary to observe X-rays and gamma rays.
Credit: NASA's Goddard Space Flight Center
3x3 Hyperwall-resolution graphic showing the Decadal Survey's reference to GLAST (now known as Fermi)
Credit: NASA's Goddard Space Flight Center
Hyperwall-resolution graphic showing the amount of silicon in various detectors.
Credit: NASA's Goddard Space Flight Center

Up-resed, UHD resolution animation of Fermi making a gamma-ray detection. Frame sequence only.
Original animation: HERE
Credit: NASA's Goddard Space Flight Center/Cruz deWilde
HD-resolution video of Fermi's position and pointing while in survey mode.
Credit: NASA's Goddard Space Flight Center/CI Lab
HD-resolution animation of Fermi repointing.
Credit: NASA's Goddard Space Flight Center/CI Lab
HD-resolution visualization of how Fermi views the entire sky over time.
Credit: NASA's Goddard Space Flight Center
Photograph of Fermi in the cleanroom being prepared for launch.
Credit: NASA/Kim Shiflett
HD-resolution graphic showing details about Fermi's launch.
Credit: NASA's Goddard Space Flight Center
Up-resed footage of Fermi's launch. Frame sequence is UHD, video is 1080 HD.
Credit: NASA
")
Graphic showing an image of a supernova remnant, the location of the pulsar in the remnant, and an illustration of the pulsar.
Credit: NASA, S. Pineault (DRAO)
UHD-resolution visualization of the Fermi all-sky map built up over time through continued observation.
Credit: NASA/DOE/ Fermi LAT Collaboration
5x3 hyperwall-resolution animation still of Fermi
Credit: NASA's Goddard Space Flight Center/CI Lab
UHD-resolution visualization of Fermi's GRB detections.
Credit: NASA's Goddard Space Flight Center
3x3 hyperwall-resolution graphic showing the locations of gamma-ray sources observed by Fermi.
Credit: NASA/DOE/ Fermi LAT Collaboration
3x3 hyperwall-resolution graphic showing the difference EGRET and Fermi's abilities to localize sources.
Credit: NASA/DOE/ Fermi LAT Collaboration

3x3 hyperwall-resolution graphic comparing the elements of the Fermi LAT with the LHC's ATLAS detector. The LAT is basically an inside-out ATLAS particle detector.
Credit: NASA's Goddard Space Flight Center/ATLAS
3x3 hyperwall-resolution visualization showing how scientists can narrow down the location of the LIGO source on the assumption that a burst seen by Fermi's GBM is connected to it.
Credit: NASA/Fermi/V. Connaughton et al. 2016
UHD-resolution animations illustrating particle beams produced by terrestrial gamma-ray flashes (TGFs) in thunderstorms.
Credit: NASA's Goddard Space Flight Center
Up-resed, 3x3 hyperwall-resolution plot locates all 117 pulsars in the Fermi LAT Two-year Point Source Catalog.
Credit: NASA/DOE/ Fermi LAT Collaboration
Fermi observations suggest possible years-long cyclic changes in gamma-ray emission from the blazar PG 1553+113. The graph shows Fermi Large Area Telescope data from August 2008 to July 2015 for gamma rays with energies above 100 million electron volts (MeV). Background: One possible explanation for the gamma-ray cycle is an oscillation of the jet produced by the gravitational pull of a second massive black hole, seen at top left in this illustration.
Credits: NASA's Goddard Space Flight Center/CI Lab
3x3 hyperwall-resolution image of the entire sky in gamma rays, constructed from more than 6 years of observations by Fermi and processed with the new Pass 8 software.
Credit: NASA/DOE/Fermi LAT Collaboration
; M87, which sports a jet that can be seen in visible light; and Centaurus A (NGC 5128), whose jet has been operating long enough to form two lobes of radio- and gamma-ray-emitting gas, each up to a million light-years long.Image credit: NASA/DOE/Fermi LAT Collaboration")
Up-resed, 3x3 hyperwall-resolution plot identifies selected active galaxies detected by Fermi's LAT. Famous members of this class include NGC 1275 (the bright radio source Perseus A); M87, which sports a jet that can be seen in visible light; and Centaurus A (NGC 5128), whose jet has been operating long enough to form two lobes of radio- and gamma-ray-emitting gas, each up to a million light-years long.
Image credit: NASA/DOE/Fermi LAT Collaboration
")
Image of the nebula CTA 1, which contains a gamma-ray pulsar.
Credit: NASA, S. Pineault (DRAO)

Illustration of a millisecond pulsar in a binary system with a larger star from which it is accreting material.
Credit: NASA's Goddard Space Flight Center/Dana Berry

Illustration of a classical nova scenario, where material accreted from a binary companion accumulates on the on the surface of a white dwarf. The surface layer eventually explodes, producing the nova outburst.
Credit: NASA's Goddard Space Flight Center/S. Wiessinger
Illustration of a pulsar orbiting a massive star, forming a high-mass X-ray binary.
Credit: NASA's Goddard Space Flight Center/CI Lab
Illustration of a binary system where a pulsar is slowly evaporating its stellar companion.
Credit: NASA's Goddard Space Flight Center/Cruz deWilde

Multiwavelength image of supernova remnant IC 443.
Credit: NASA/DOE/Fermi LAT Collaboration, NOAO/AURA/NSF, JPL-Caltech/UCLA

Multiwavelength image of galaxy M82.
Credit:NASA/JPL-Caltech/STScI/CXC/UofA/ESA/AURA/JHU

Globular clusters are ancient groupings of stars that orbit our galaxy. This view of globular cluster NGC 6624 was imaged by the NASA's Hubble Space Telescope. The cluster is 27,000 light-years away and lies farther than the center of our galaxy in the constellation Sagittarius.
Credit: NASA/ESA/I. King, Univ. of Calif., Berkeley/Wikisky.org

Chandra and Hubble image of the Crab Nebula's central region, where the pulsar is located.
Credit: NASA/HST/CXC/ASU/J. Hester et al.

This image is a view of the Sun captured by NASA’s Solar Dynamics Observatory on Oct. 7, 2010, while partially obscured by the Moon. A close look at the crisp horizon of the Moon against the Sun shows the outline of lunar mountains. A model of the Moon from NASA’s Lunar Reconnaissance Orbiter has been inserted into the picture, showing how perfectly the Moon's true topology fits into the shadow observed by SDO.
Credit: NASA/SDO/LRO/GSFC
Illustration of a pulsar producing narrow radio beams (green), which do not intersect Earth, and broad gamma ray emission (magenta) that does.
Credit: NASA/Fermi/Cruz deWilde

Illustration of a binary system where a pulsar is slowly destroying its small binary companion.
Credit: NASA's Goddard Space Flight Center/Cruz deWilde

Image of a portion of the Large Magellanic Cloud with Fermi gamma-ray imagery showing bright sources centered on the Tarantuala Nebula.
Credit: C. Smith, S. Points, the MCELS Team, NOAO/AURA/NSF and NASA/DOE/Fermi LAT Collaboration
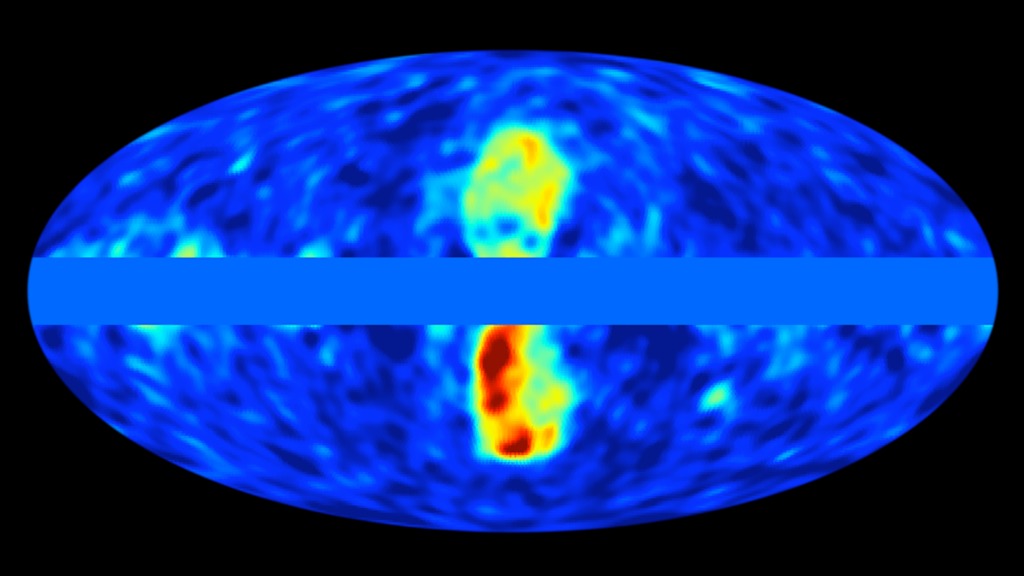
Fermi data from the center of the Milky Way superimposed over a visible light image of the same region.
Credit: NASA Goddard/A. Mellinger (Central Michigan Univ.) and T. Linden (Univ. of Chicago)
Illustration of one possible model for the dramatic changes observed from J1023. The two stars of AY Sextantis orbit closely enough that a stream of gas flows from the sun-like star toward the pulsar. The pulsar's rapid rotation and intense magnetic field produce both the radio beam and the high-energy wind, which is eroding its companion. When the radio beam (green) is detectable, the pulsar wind holds back the companion's gas stream, preventing it from approaching too closely.
Credit: NASA's Goddard Space Flight Center/Cruz deWilde
 as the blast wave plowed through the gas-rich environment near the system's red giant star. Credit: NASA's Goddard Space Flight Center/S. Wiessinger")
The white dwarf star in V407 Cygni, shown here in an artist's concept, went nova in 2010. Scientists think the outburst primarily emitted gamma rays (magenta) as the blast wave plowed through the gas-rich environment near the system's red giant star.
Credit: NASA's Goddard Space Flight Center/S. Wiessinger

Illustration of a binary system where a pulsar is slowly destroying its small binary companion.
Credit: NASA's Goddard Space Flight Center/Cruz deWilde
The Fermi logo.
Credit: NASA/DOE/Fermi LAT Collaboration
Credits
Please give credit for this item to:
NASA's Goddard Space Flight Center
-
Animator
- Scott Wiessinger (USRA)
-
Producer
- Scott Wiessinger (USRA)
Missions
This page is related to the following missions:Series
This page can be found in the following series:Related
- ID: 12102
 Produced Video
Release date
This page was originally published on Monday, January 4, 2016.
This page was last updated on Sunday, February 2, 2025 at 11:18 PM EST.