NASA Takes You Inside Hurricane Joaquin Live Shots
NASA takes you inside Hurricane Joaquin
Link to Global Precipitation Measurement mission page.
Social Media soundbite from NASA Scientist Dr. Dalia Kirschbaum
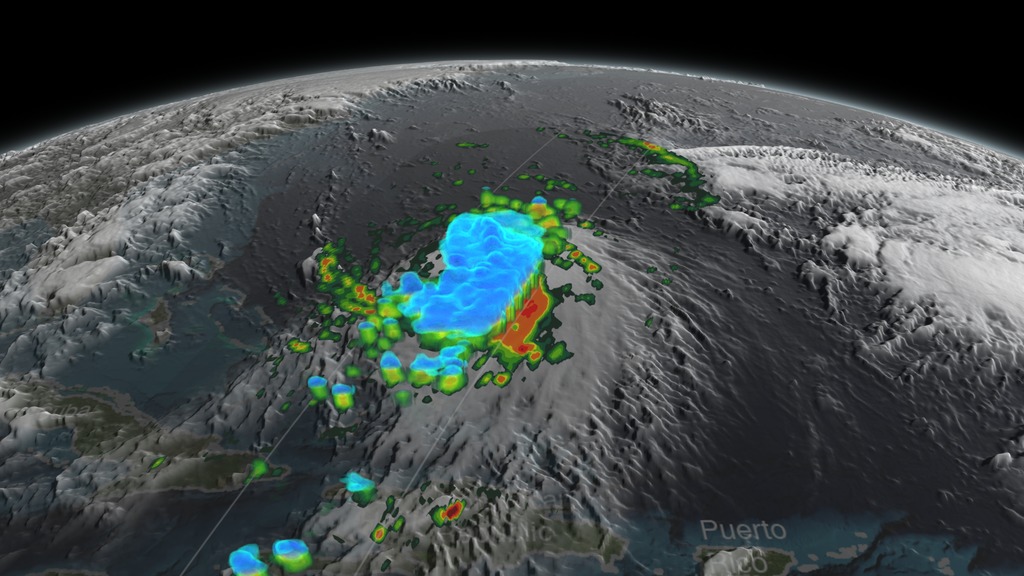
Animation of Tropical Storm Joaquin on September 29, 2015 right before it intensified into a hurricane.
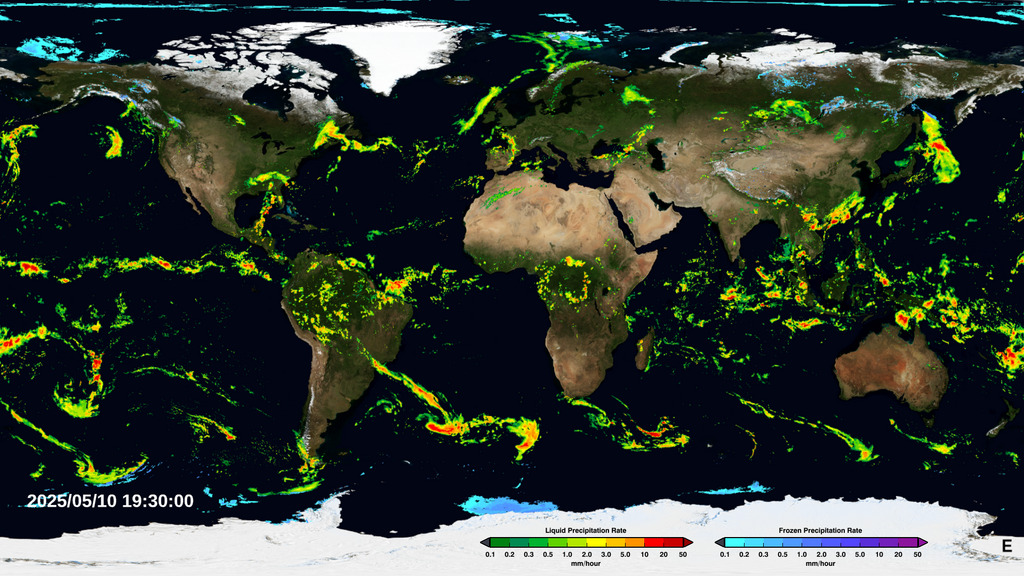
Precipitation around the world. Graphic zooms into the Atlantic ocean along the U.S. Coast
Rain accumulation between Sept. 27-Oct. 1.
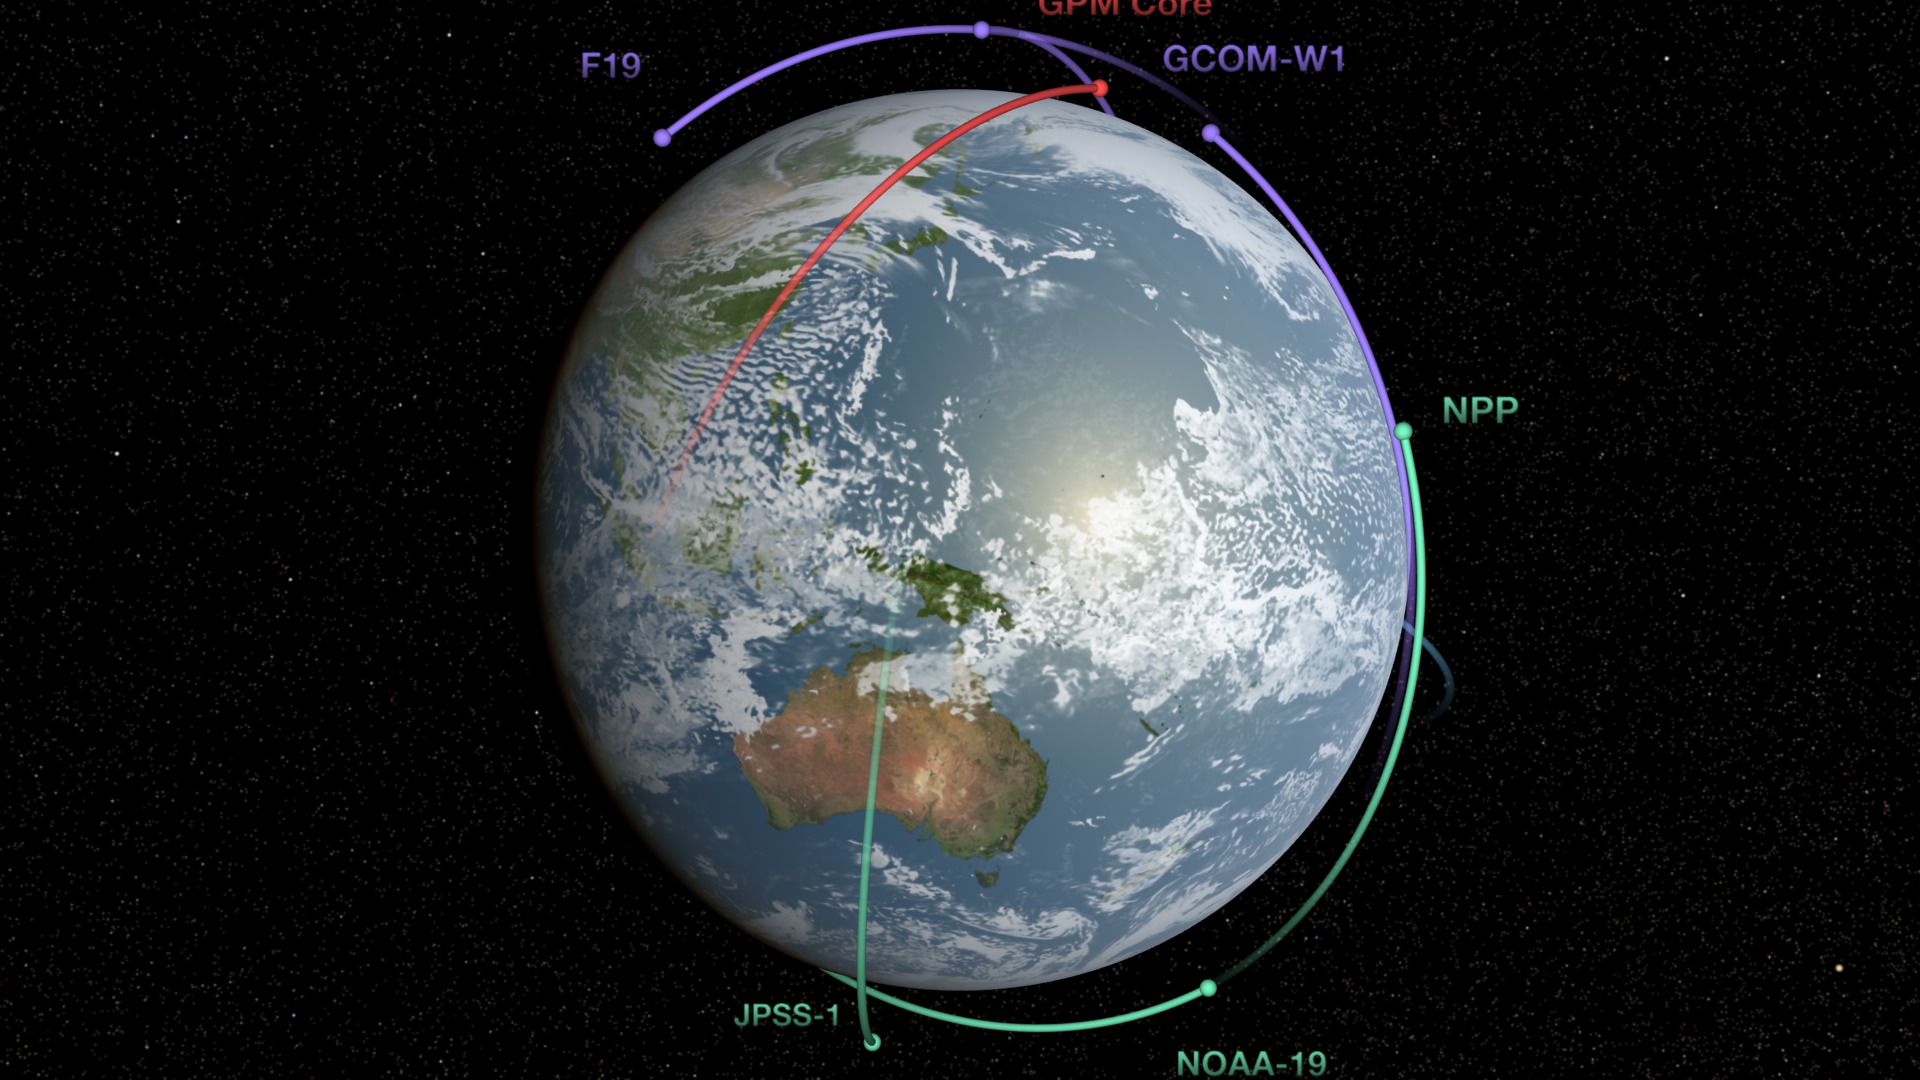
Global Precipitation Measurement (GPM) core observatory satellite beauty pass.
Global Precipitation Measurement (GPM) mission network of satellite
For More Information
Credits
Please give credit for this item to:
NASA's Goddard Space Flight Center
-
Producers
- Michelle Handleman (USRA)
- Claire Saravia (NASA/GSFC)
-
Editor
- Stuart A. Snodgrass (HTSI)
Missions
This page is related to the following missions:Series
This page can be found in the following series:Related
- ID: 4367
 Visualization
 - ID: 4285
- ID: 3971
 Visualization
Release date
This page was originally published on Friday, October 2, 2015.
This page was last updated on Wednesday, December 9, 2015 at 11:25 AM EST.