The Evolving Arctic

A NASA analysis of satellite data reveals the 2015 Arctic sea ice minimum extent is one of the lowest on record.
Arctic sea ice, the cap of frozen seawater floating on top of the Arctic Ocean and adjacent seas, hit its yearly summertime minimum extent on Sept. 11. At 1.70 million square miles, this year’s minimum extent is the fourth lowest on the satellite record. The sea ice cover grows and shrinks with the seasons but its minimum summertime extent has been in decline since the late 1970s in response to warming temperatures. Despite no extraordinary meteorological conditions during this summer that could have contributed to the melt, the weakened state of the ice has led to a 2015 minimum extent that is 699,000 square miles smaller than the 1981-2010 average. This is equivalent to losing an area of sea ice larger than the state of Alaska. Watch the video to see the evolution of this year's Arctic sea ice cover from its wintertime maximum extent to its summertime minimum.
This visualization created from satellite observations shows sea ice and land cover changes from Feb. 25 to Sept. 11, 2015.
This year's Arctic sea ice maximum extent (shown above) was reached on Feb. 25, and covered 5.61 million square miles.
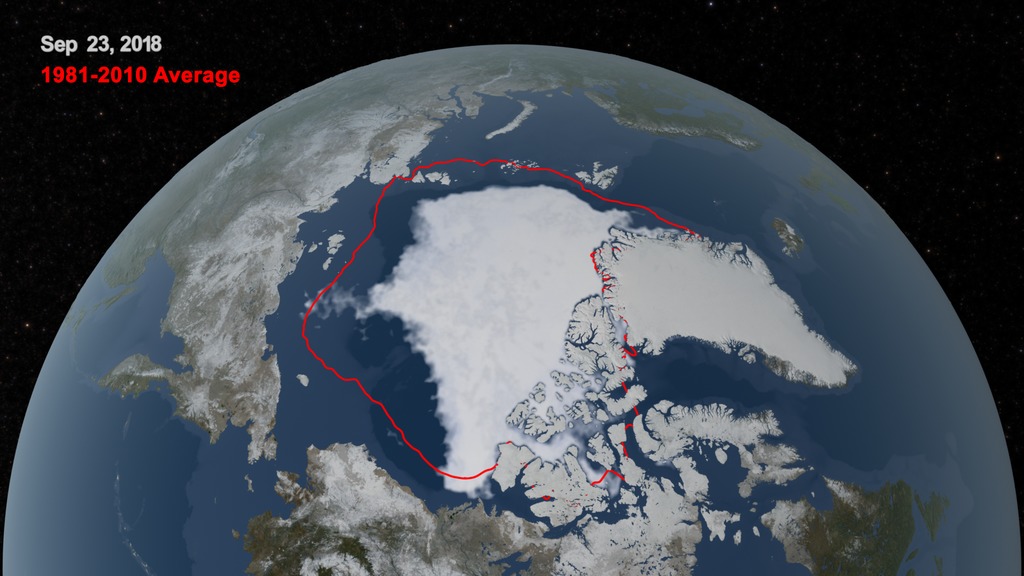
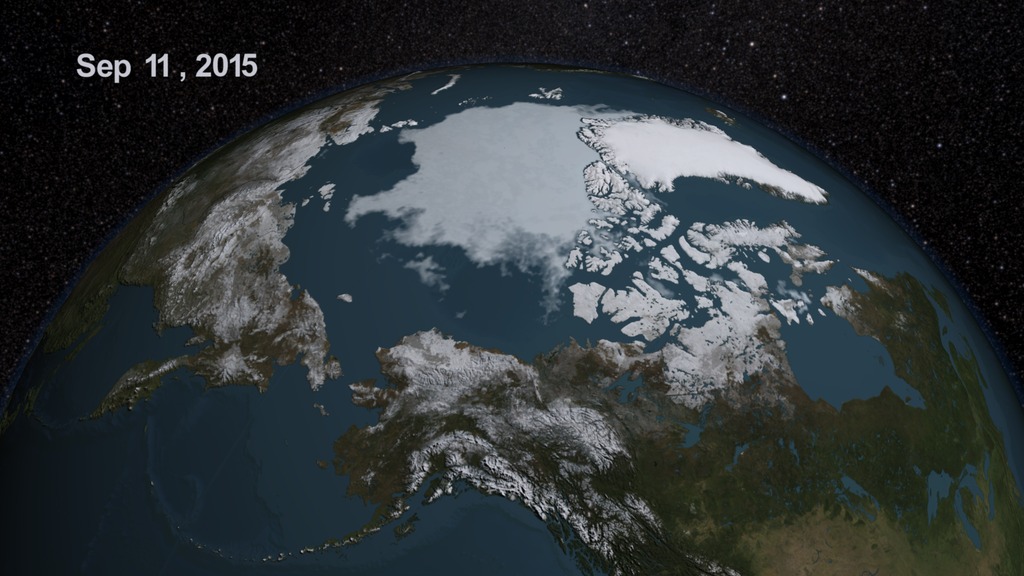
Arctic sea ice hit its minimum extent (shown above) on Sept. 11, and covered 1.70 million square miles. It was the fourth lowest minimum on record.
The current minimum sea ice extent is almost a third smaller than the historical average from 1981-2010 (yellow line, above).
For More Information
See NASA.gov
Credits
Please give credit for this item to:
NASA's Scientific Visualization Studio
-
Writer
- Maria-Jose Vinas Garcia (Telophase)
-
Producer
- Sophia Roberts (USRA)
-
Scientists
- Josefino Comiso (NASA/GSFC)
- Walt Meier (NASA/GSFC)
-
Animator
-
Cindy Starr
(Global Science and Technology, Inc.)

-
Cindy Starr
(Global Science and Technology, Inc.)
-
Project support
- Robert Gersten (RSIS)
- Laurence Schuler (ADNET Systems, Inc.)
- Ian Jones (ADNET Systems, Inc.)
Sources
- ID: 4684
 Visualization
 - ID: 4355
 Visualization
Release date
This page was originally published on Thursday, September 17, 2015.
This page was last updated on Wednesday, May 3, 2023 at 1:49 PM EDT.