The Planet Around Beta Pictoris Makes Waves
Watch: Erika Nesvold and Marc Kuchner discuss how their new supercomputer simulation helps astronomers understand Beta Pictoris.
Music:"Deep Layer" by Lars Leonhard, courtesy of the artist.
Watch this video on the NASA Goddard YouTube channel.
Video credit: NASA's Goddard Space Flight Center
For complete transcript, click here.
A new NASA supercomputer simulation of the planet and debris disk around the nearby star Beta Pictoris reveals that the planet's motion drives spiral waves throughout the disk, a phenomenon that greatly increases collisions among the orbiting debris. Patterns in the collisions and the resulting dust appear to account for many observed features that previous research has been unable to fully explain.
Astronomers Erika Nesvold (UMBC) and Marc Kuchner (NASA Goddard) essentially created a virtual Beta Pictoris in the computer and watched it evolve over millions of years. It is the first full 3-D model of a debris disk where scientists can watch the development of asymmetric features formed by planets, like warps and eccentric rings, and also track collisions among the particles at the same time.
Loopable video and gif of the simulated Beta Pictoris disk rotated through 360 degrees
Credit: NASA Goddard Scientific Visualization Studio
View of the simulated Beta Pictoris disk with a portion cut away to show the vertical wave driven by the planet’s inclined orbit.
Credit: NASA Goddard Scientific Visualization Studio
Video of Beta Pictoris disk simulation showing the evolution of the mass density in cross section over time.
NASA/Erika Nesvold and Marc Kuchner
 equals the average distance between Earth and the Sun. Credit: NASA’s Goddard Space Flight Center/Erika Nesvold and Marc Kuchner")
Labeled version. This map of the SMACK Beta Pictoris simulation shows where collisions among icy and rocky debris occur most frequently in the disk. This edge-on view shows a slice through the disk. The tilt of the planet’s orbit drives particles above and below the disk plane, creating vertical waves. Particles pile up in the crests and troughs of the waves, enhancing the rate of collisions at this location. The orbit of the planet, Beta Pictoris b, is shown in green. At top, the solar system is shown to scale. One Astronomical Unit (AU) equals the average distance between Earth and the Sun.
Credit: NASA’s Goddard Space Flight Center/Erika Nesvold and Marc Kuchner
 equals the average distance between Earth and the Sun. No Labels. Credit: NASA’s Goddard Space Flight Center/Erika Nesvold and Marc Kuchner")
Unlabeled version. This map of the SMACK Beta Pictoris simulation shows where collisions among icy and rocky debris occur most frequently in the disk. This edge-on view shows a slice through the disk. The tilt of the planet’s orbit drives particles above and below the disk plane, creating vertical waves. Particles pile up in the crests and troughs of the waves, enhancing the rate of collisions at this location. The orbit of the planet, Beta Pictoris b, is shown in green. At top, the solar system is shown to scale. One Astronomical Unit (AU) equals the average distance between Earth and the Sun. No Labels.
Credit: NASA’s Goddard Space Flight Center/Erika Nesvold and Marc Kuchner
 equals the average distance between Earth and the Sun. Credit: NASA’s Goddard Space Flight Center/Erika Nesvold and Marc Kuchner")
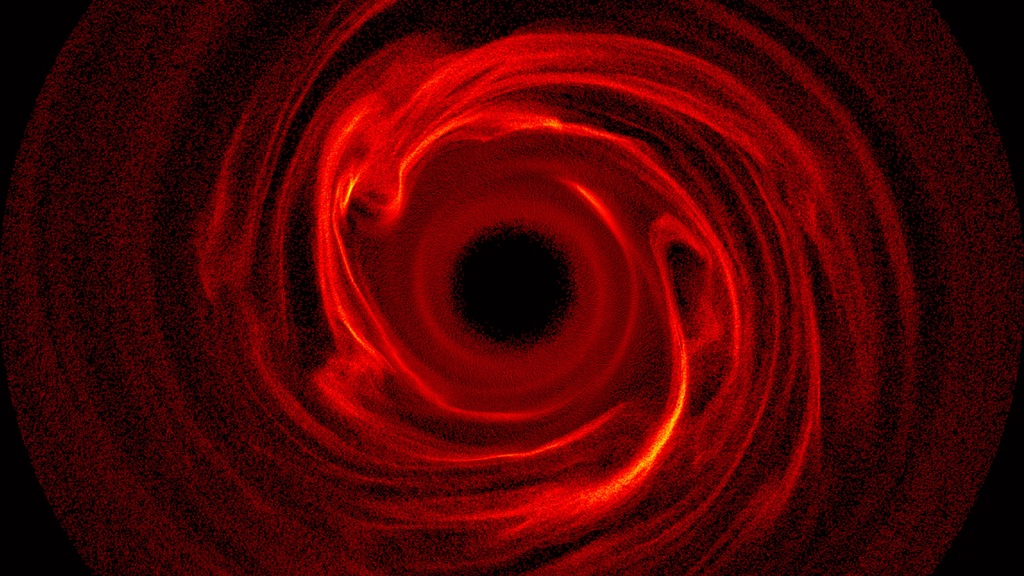
This map of the SMACK Beta Pictoris simulation shows where collisions among icy and rocky debris occur most frequently in the disk. The planet’s slightly elongated orbit drives a spiral density wave across the disk. The spacing of the pattern steadily increases with greater distance from the planet’s orbit. Collisions driven by the density wave grind away larger particles and, after the 21 million years of the simulation, already have cleared them out of the central region near the star. The orbit of the planet, Beta Pictoris b, is shown in green. At top, the solar system is shown to scale. One Astronomical Unit (AU) equals the average distance between Earth and the Sun.
Credit: NASA’s Goddard Space Flight Center/Erika Nesvold and Marc Kuchner
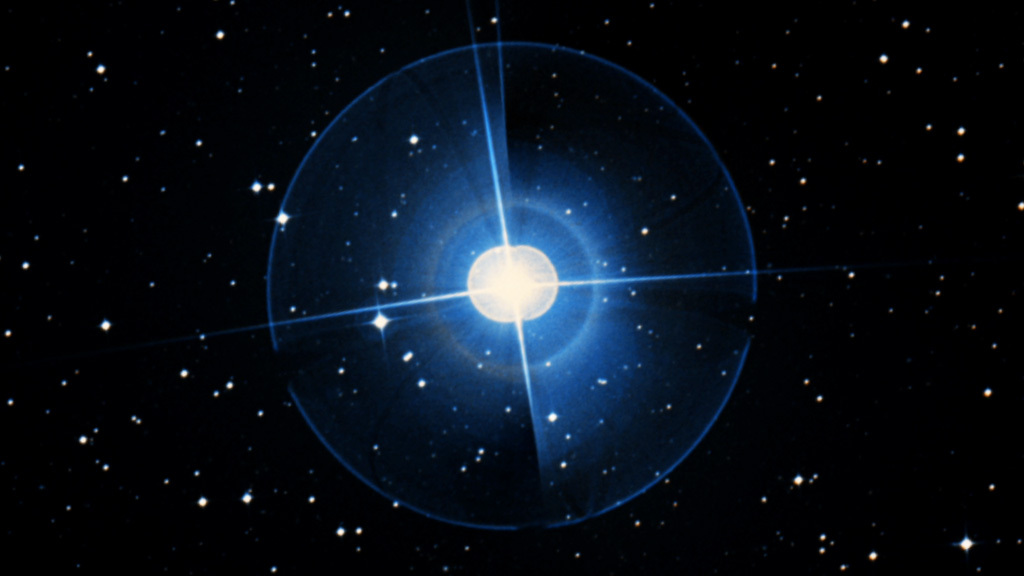
 with a similar view constructed from data in the SMACK simulation (red overlay, bottom). The X pattern in the Hubble image forms as a result of a faint secondary dust disk inclined to the main debris disk. Previous simulations were unable to reproduce this feature, but the SMACK model replicates the overall pattern because it captures the three-dimensional distribution of the collisions responsible for making the dust. Credit: Top, NASA/ESA and D. Golimowski (Johns Hopkins Univ.); bottom, NASA Goddard/E. Nesvold and M. Kuchner")
Labeled version. These images compare a view of Beta Pictoris in scattered light as seen by the Hubble Space Telescope (top) with a similar view constructed from data in the SMACK simulation (red overlay, bottom). The X pattern in the Hubble image forms as a result of a faint secondary dust disk inclined to the main debris disk. Previous simulations were unable to reproduce this feature, but the SMACK model replicates the overall pattern because it captures the three-dimensional distribution of the collisions responsible for making the dust.
Credit: Top, NASA/ESA and D. Golimowski (Johns Hopkins Univ.); bottom, NASA Goddard/E. Nesvold and M. Kuchner
Unlabeled version. These images compare a view of Beta Pictoris in scattered light as seen by the Hubble Space Telescope (top) with a similar view constructed from data in the SMACK simulation (red overlay, bottom). The X pattern in the Hubble image forms as a result of a faint secondary dust disk inclined to the main debris disk. Previous simulations were unable to reproduce this feature, but the SMACK model replicates the overall pattern because it captures the three-dimensional distribution of the collisions responsible for making the dust. No Labels.
Credit: Top, NASA/ESA and D. Golimowski (Johns Hopkins Univ.); bottom, NASA Goddard/E. Nesvold and M. Kuchner
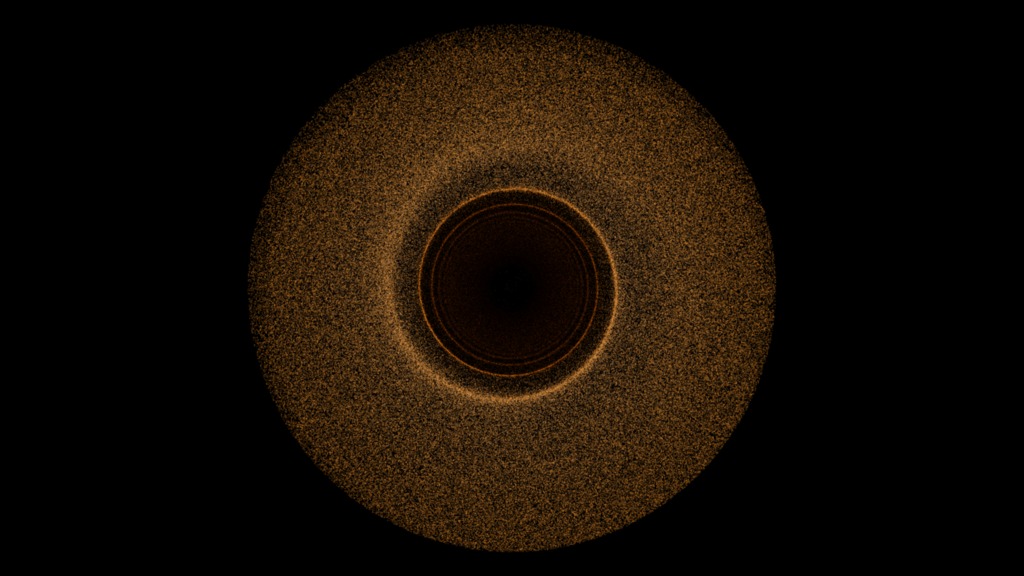
Top: A simulated scattered light image based on data from the Beta Pictoris model. Bottom: The same image, with white lines drawn along the spines of the inclined components of the dust distribution. The two lines do not intersect at the star and have different angles relative to the main disk.This result replicates the well-known “wing-tilt asymmetry" seen in real scattered light images of the disk.
Credit: NASA’s Goddard Space Flight Center/Erika Nesvold and Marc Kuchner
For More Information
Credits
Please give credit for this item to:
NASA's Goddard Space Flight Center. However, individual items should be credited as indicated above.
-
Producer
- Scott Wiessinger (USRA)
-
Animator
- Tom Bridgman (Global Science and Technology, Inc.)
-
Writer
- Francis Reddy (Syneren Technologies)
-
Scientists
- Marc Kuchner (NASA/GSFC)
- Erika Nesvold (UMBC)
-
Interviewees
- Erika Nesvold (UMBC)
- Marc Kuchner (NASA/GSFC)
-
Editor
- Scott Wiessinger (USRA)
-
Videographers
- Rob Andreoli (Advocates in Manpower Management, Inc.)
- John Caldwell (Advocates in Manpower Management, Inc.)
Series
This page can be found in the following series:Tapes
The media on this page originally appeared on the following tapes:-
Beta Pictoris Disk Simulation
(ID: 2015052)
Thursday, June 25, 2015 at 4:00AM
Produced by - Robert Crippen (NASA)
Related
- ID: 12807
 Produced Video
 - ID: 12054
 Produced Video
 - ID: 4317
 Visualization
 - ID: 11499
 Produced Video
Release date
This page was originally published on Thursday, June 25, 2015.
This page was last updated on Wednesday, May 3, 2023 at 1:49 PM EDT.