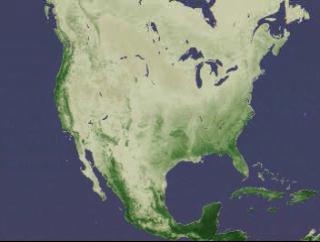
Seasonal NDVI for North America: 1981-2000 Averaged, With Month Notation
Seasonal NDVI for North America. 1981-2000 averaged with month notation. 15 frames/month
Seasonal NDVI movie for North America.

Video slate image reads,
"NDVI/Drought in North America
1981-2000
Seasonal Average with Month Notation".
For More Information
Credits
Please give credit for this item to:
NASA/Goddard Space Flight Center
Scientific Visualization Studio
-
Animator
- Tom Bridgman (Global Science and Technology, Inc.)
-
Scientist
- Robert Mahoney (NASA/GSFC)
Series
This page can be found in the following series:Datasets used
-
NDVI [NOAA: AVHRR]
ID: 426
Note: While we identify the data sets used on this page, we do not store any further details, nor the data sets themselves on our site.
Alternate Versions
- ID: 1181
Release date
This page was originally published on Wednesday, August 23, 2000.
This page was last updated on Wednesday, May 3, 2023 at 1:58 PM EDT.