High-Resolution True Color Earth Imagery Simulated by GEOS During the 2026 Total Solar Eclipse
On August 12, 2026, a total solar eclipse will cross the Northern Hemisphere. This visualization presents a high-resolution, simulated view of Earth from space between August 9–13, 2026, using the GEOS-CAM model. By applying the GOES true color algorithm to simulated radiation data, it generates realistic imagery incorporating aerosols like dust and smoke. This helps infer localized visibility along the path of totality.
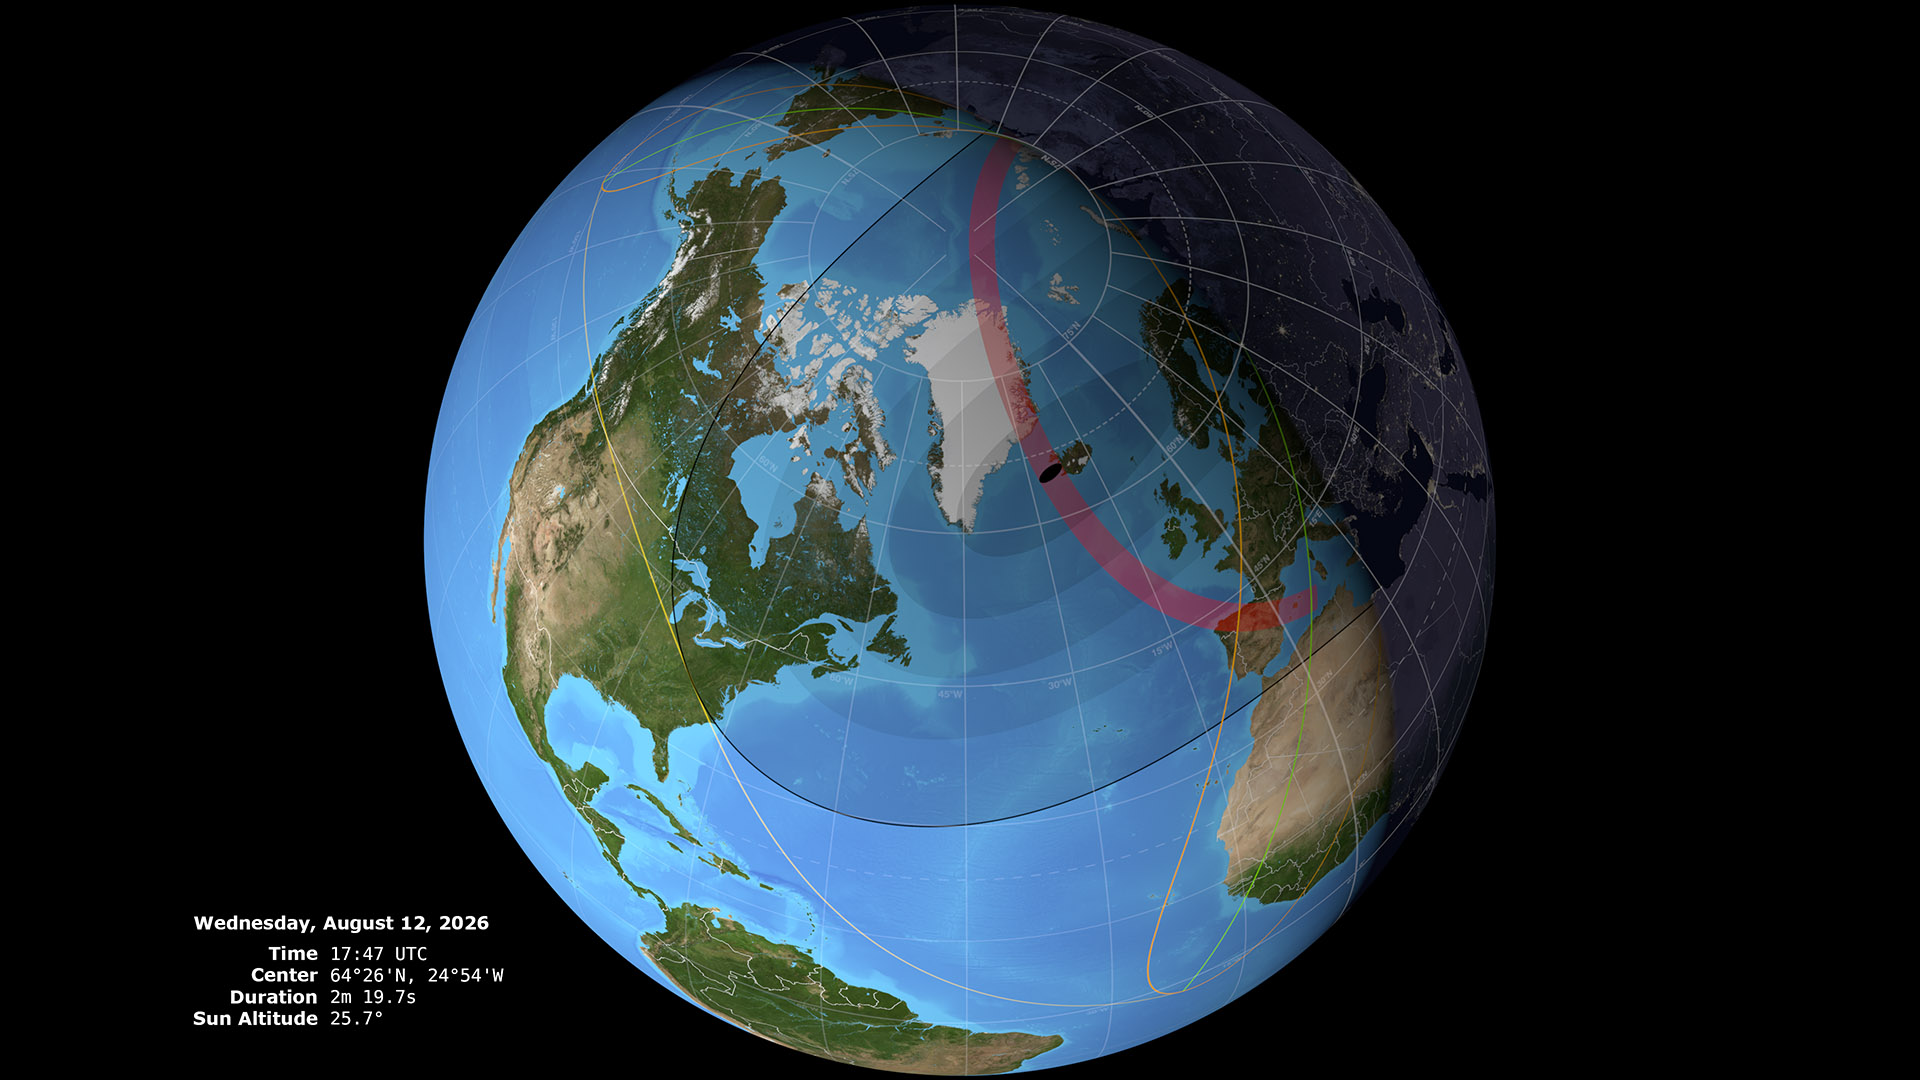
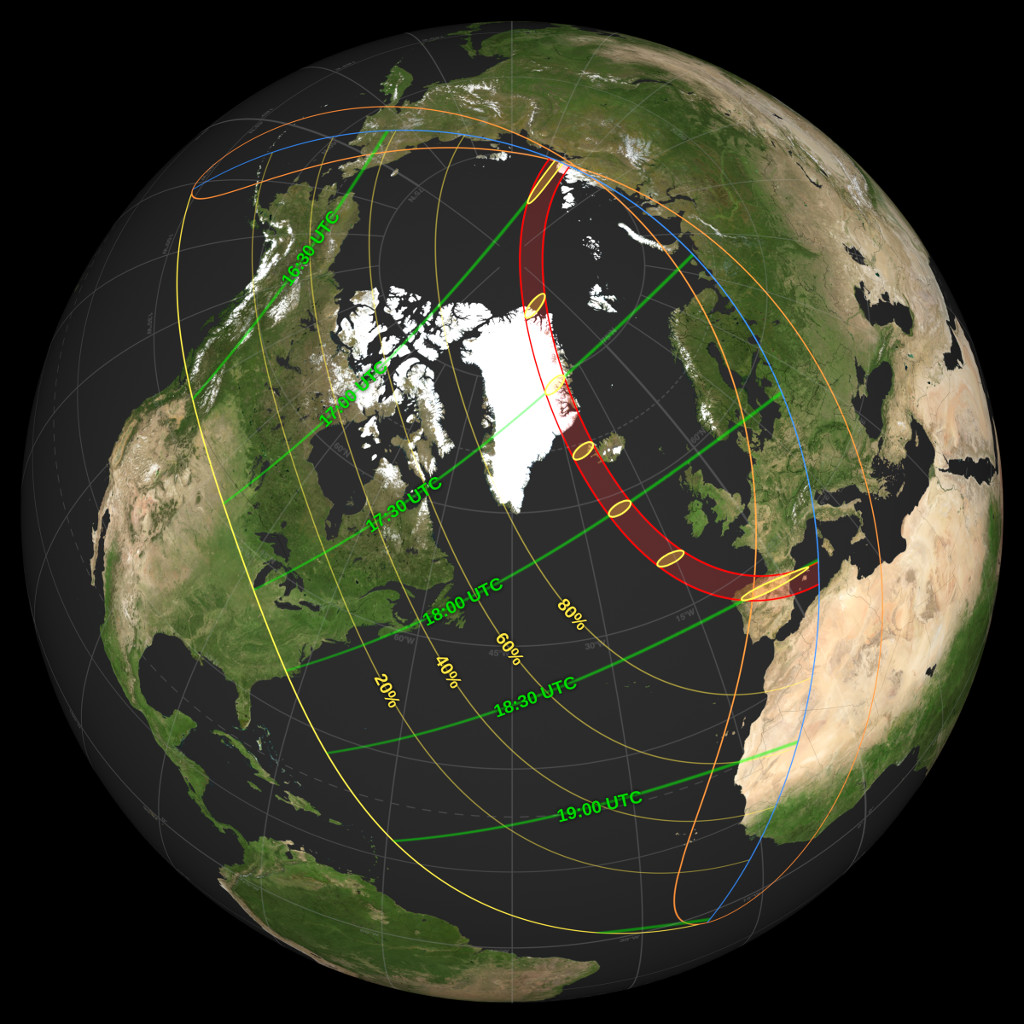
On Wednesday, August 12, 2026, the Moon passes in front of the Sun, casting its shadow across a wide swath of Earth's Northern Hemisphere. The path of totality begins in far northern Siberia near the North Pole, and travels south through the Arctic and North Atlantic oceans, passing over Iceland and Spain. Meanwhile, the rest of Europe and parts of North America and Africa experience a partial eclipse.
To anticipate viewing conditions for this event, this visualization presents a high-resolution, model-simulated view of Earth spanning the period of August 9–13, 2026, using the GEOS-CAM model. GEOS-CAM simulates multiple bands of incoming and outgoing shortwave radiation, analogous to the observational data collected by GOES satellites. By applying the GOES true color (GeoColor) algorithm to these model-generated fields, this visualization derives a realistic representation of how the Earth will appear from space. Crucially, the simulation incorporates the atmospheric impacts of aerosols such as dust and smoke, making the resulting imagery a valuable tool for inferring localized visibility conditions along the path of totality.
For more detailed information about the eclipse, visit: Map of the August 12, 2026, Total Solar Eclipse

Simulated view of Earth on August 12, 2026, at 18:30 UTC, showing true-color GEOS-CAM model imagery with the solar eclipse path.
Simulated view of Earth on August 12, 2026, at 18:30 UTC, showing true color GEOS-CAM model imagery.
A high-resolution, simulated view of Earth on August 12, 2026, at 18:30 UTC, showing true-color GEOS-CAM model imagery of Earth on August 12, 2026, at 18:30 UTC.
Credits
NASA's Global Modeling Assimilation Office (GMAO) and NASA's Scientific Visualization Studio (SVS)
-
Data visualizers
- William Putman (NASA/GSFC)
-
Ernie Wright
(USRA)

-
Joseph V. Ardizzone
(NASA/GSFC)
-
Helen-Nicole Kostis
(Science and Technology Corporation)
-
Scientific support
-
Allison Collow
(University of Maryland Baltimore County)
-
Allison Collow
(University of Maryland Baltimore County)
Datasets used
-
GEOS-CAM (Goddard Earth Observing System Convection-Allowing Model framework)
ID: 1290Credit: NASA Global Modeling Assimilation Office (GMAO)
See all pages that use this dataset
Note: While we identify the data sets used on this page, we do not store any further details, nor the data sets themselves on our site.
Related
- ID: 15065
![Complete transcript available.Watch this video on the NASA Goddard YouTube channel.Music Credit: “Uncovered Discovered” by Emanuel Kallins [BMI] and Chieli Minucci [ASCAP] from Universal Production Music](/vis/a010000/a015000/a015065/15065_Thumbnail.jpg) Produced Video
Produced Video - ID: 5656
 Visualization
 - ID: 5647
 Visualization
Sources
- ID: 5647Visualization
Release date
This page was originally published on Tuesday, August 11, 2026.
This page was last updated on Wednesday, August 12, 2026 at 10:16 AM EDT.