3-D Blizzard

A NASA satellite looks inside the winter storm that hit the northeastern U.S. in January 2015.
Winter in the northeastern United States is bleak. Biting cold air streams down from Canada, while storms like nor’easters can dump enough snow and ice to shut down cities for days. When a nor’easter begins to whirl, accurate forecasts are crucial in determining how much snow will land where. In 2014, NASA launched the Global Precipitation Measurement (GPM) mission to visualize storms in three dimensions—and a January 2015 nor’easter was the perfect opportunity for it to strut its stuff. High-precision radar aboard GPM’s Core Observatory satellite mapped the vertical distribution of rain and snow, while a microwave imager pierced the atmosphere like an X-ray to create a detailed projection of precipitation rates along the storm’s base. Together, these tools identified the wettest and most forceful parts of the nor’easter. Watch the video to see the winter storm in 3-D.
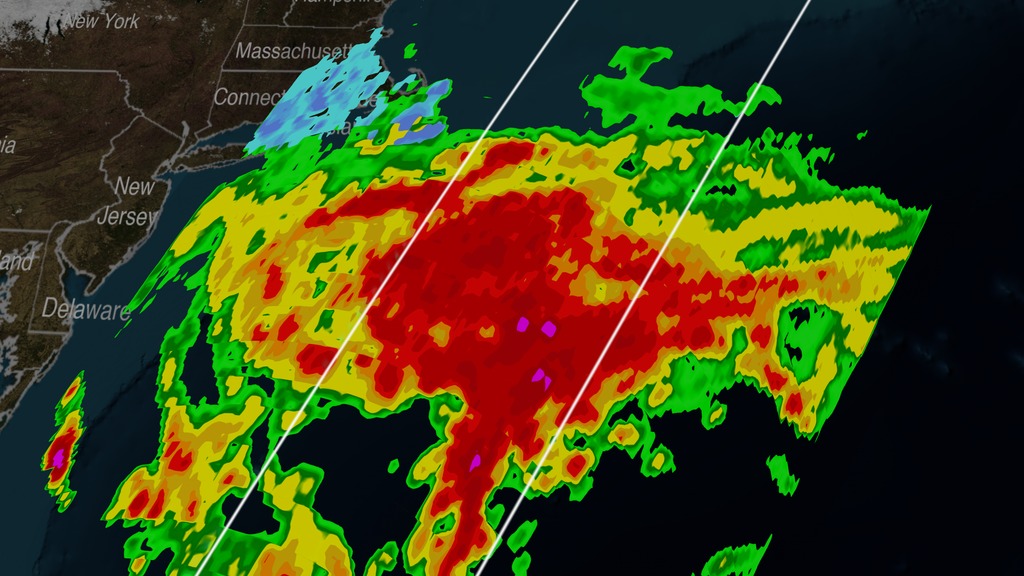
This visualization shows GPM’s view of the storm on Jan. 26. Green to red is light to dense rain; blue to purple is light to dense snow.
The satellite produced this image showing the surface precipitation rate and vertical distribution of rain and snow falling from the storm.
When air is warm, falling snow turns to rain. This 3-D cross section captures the transition from snow (blue/purple) to rain (red/orange).
Most of the surface precipitation GPM detected was rain, except for the moderate snowfall (blue) it observed over parts of New England.
For More Information
See NASA.gov
Credits
Please give credit for this item to:
NASA's Scientific Visualization Studio
-
Animators
-
Alex Kekesi
(Global Science and Technology, Inc.)

-
Greg Shirah
(NASA/GSFC)
-
Alex Kekesi
(Global Science and Technology, Inc.)
-
Producers
- Ryan Fitzgibbons (USRA)
- Rani Gran (NASA/GSFC)
-
Scientists
- Gail Skofronick Jackson (NASA/GSFC)
- Dalia B Kirschbaum (NASA/GSFC)
-
George Huffman
(NASA/GSFC)
-
Writer
- Kerry Klein (USRA)
Related
- ID: 4266
 Visualization
Release date
This page was originally published on Tuesday, February 10, 2015.
This page was last updated on Wednesday, May 3, 2023 at 1:50 PM EDT.