NASA Missions Take an Unparalleled Look into Superstar Eta Carinae
Explore Eta Carinae from the inside out with the help of supercomputer simulations and data from NASA satellites and ground-based observatories.
Credit: NASA's Goddard Space Flight Center
Watch this video on the NASA Goddard YouTube channel.
For complete transcript, click here.
Eta Carinae is a binary system containing the most luminous and massive star within 10,000 light-years. A long-term study led by astronomers at NASA's Goddard Space Flight Center in Greenbelt, Maryland, combined data from NASA satellites, ground-based observing campaigns and theoretical modeling to produce the most comprehensive picture of Eta Carinae to date. New findings include Hubble Space Telescope images that show decade-old shells of ionized gas racing away from the largest star at a million miles an hour, and new 3-D models that reveal never-before-seen features of the stars' interactions.
Located about 7,500 light-years away in the southern constellation of Carina, Eta Carinae comprises two massive stars whose eccentric orbits bring them unusually close every 5.5 years. Both produce powerful gaseous outflows called stellar winds, which enshroud the stars and stymy efforts to directly measure their properties. Astronomers have established that the brighter, cooler primary star has about 90 times the mass of the sun and outshines it by 5 million times. While the properties of its smaller, hotter companion are more contested, Goddard's Ted Gull and his colleagues think the star has about 30 solar masses and emits a million times the sun's light.
At closest approach, or periastron, the stars are 140 million miles (225 million kilometers) apart, or about the average distance between Mars and the sun. Astronomers observe dramatic changes in the system during the months before and after periastron. These include X-ray flares, followed by a sudden decline and eventual recovery of X-ray emission; the disappearance and re-emergence of structures near the stars detected at specific wavelengths of visible light; and even a play of light and shadow as the smaller star swings around the primary.
During the past 11 years, spanning three periastron passages, the Goddard group has developed a model based on routine observations of the stars using ground-based telescopes and multiple NASA satellites. According to this model, the interaction of the two stellar winds accounts for many of the periodic changes observed in the system. The winds from each star have markedly different properties: thick and slow for the primary, lean and fast for the hotter companion. The primary's wind blows at nearly 1 million mph and is especially dense, carrying away the equivalent mass of our sun every thousand years. By contrast, the companion's wind carries off about 100 times less material than the primary's, but it races outward as much as six times faster.
The images and videos on this page include periastron observations from NASA's Rossi X-ray Timing Explorer, the X-Ray Telescope aboard NASA's Swift, the Hubble Space Telescope's STIS instrument, and computer simulations. See the captions for details.
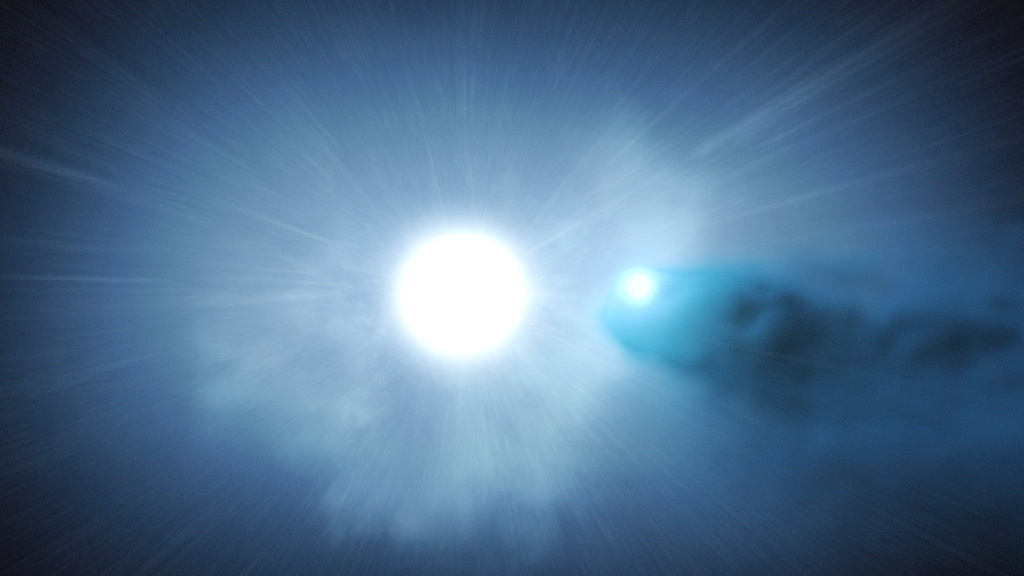
This animation zooms from outside the Homunculus Nebula, which Eta Carinae ejected in a famous outburst in the 19th century, to the system's two massive orbiting stars.
Credit: NASA Goddard CI Lab
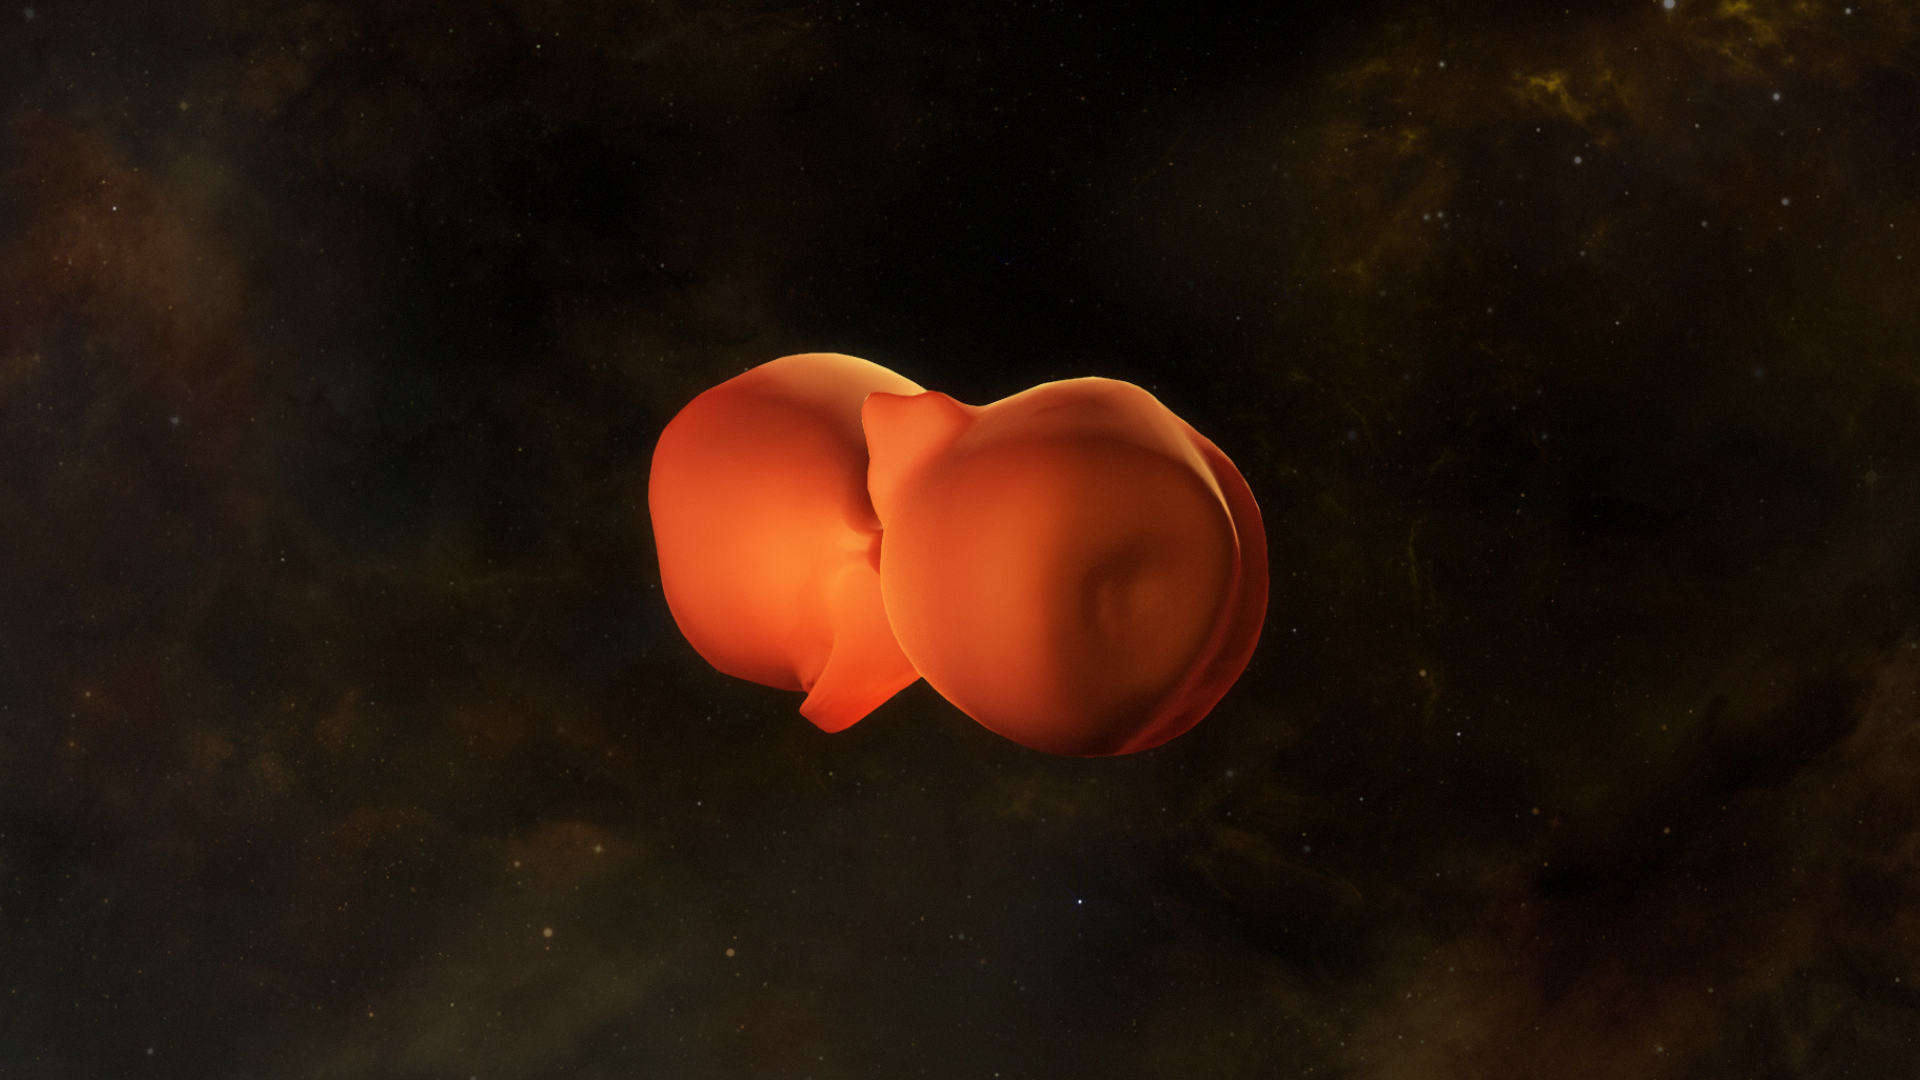
This digital model of Eta Carinae was created from hydrodynamic simulations performed on a NASA supercomputer. The gray area shows the dense wind of the primary star. The gold region shows the high-temperature region where the opposing stellar winds interact. The system is shown three months after the stars' closest approach. Converting the simulation to a digital model for 3-D printing revealed spine-like protrusions (left) from the interaction region that had not been noticed in the simulations. This strucuture is likely caused by instabilities in gas flowing along the walls of the cavity hollowed out by the smaller, hotter star.
Download the Eta Car colliding wind models for 3D printing:
high mass-loss version
low mass-loss version
Credit: NASA Goddard CI Lab
Same as above, but shows the system when the stars are at closest approach (periastron).
Credit: NASA Goddard CI Lab
Same as above, but the model shows the system when the stars are farthest apart (apastron).
Credit: NASA Goddard CI Lab
 across, a distance slightly larger than the diameter of Saturn's orbit in our solar system. Credit: NASA's Goddard Space Flight Center/T. Madura For 4k frames and video of this and several other simulation renderings, go toour page #11722.")
In this supercomputer simulation, the stars of Eta Carinae are shown as black dots in a view above their orbital plane. Lighter colors indicate greater densities in the stellar winds produced by each star. At closest approach, the fast wind of the smaller star carves a tunnel in the thicker wind of the larger star. The scene is 20 astronomical units (1.9 billion miles or 2.9 billion km) across, a distance slightly larger than the diameter of Saturn's orbit in our solar system.
Credit: NASA's Goddard Space Flight Center/T. Madura
For 4k frames and video of this and several other simulation renderings, go toour page #11722.
Same as above, but depicts a scene 10 times larger.
Credit: NASA's Goddard Space Flight Center/T. Madura
Same as above, but showing a scene 10 times larger. This movie shows a wide view of the system looking along the orbital plane of the two stars, located at the center. The view spans 3,200 times the average distance between Earth and the sun, or 298 billion miles (478 billion kilometers). Lighter colors indicate greater densities, with the highest densities occuring near the primary and in the wind interaction region. The faster wind of the smaller star carves a spiral cavity into the dense wind of the primary star, and this structure expands outward with the primary wind.
Credit: NASA's Goddard Space Flight Center/T. Madura
Seen in blue light emitted by doubly ionized iron atoms (4659 angstroms), these images of Eta Carinae were captured by Hubble's STIS instrument between 2010 and 2014. Gas shells created during the binary's 2003 close approach race outward at about 1 million mph (1.6 million km/h). The structure vanishes at this wavelength when the stars approach and the UV light of the smaller, hotter star, which excites this emission, is aborbed by the densest part of the primary star's wind.
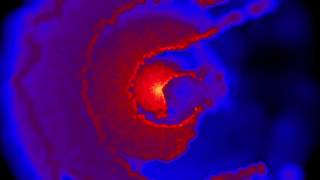
This animation shows changes in Eta Carinae's X-ray brightness observed near periastron passages from 1998 to 2014 by NASA's Rossi X-ray Timing Explorer (RXTE) and the X-Ray Telescope on NASA's Swift satellite. The brightest emission yet seen arose from flares in mid-2014, when the stars were approaching each other. The background is an X-ray image of the system taken by NASA's Chandra X-ray Observatory, and the brightest X-ray variations seen in the RXTE and Swift data have been superimposed on it. Optical data suggests the 2014 X-ray flares were a product of changes in the wind of the system's smaller, hotter star.
Credit: NASA's Goddard Space Flight Center/M. Corcoran
Preparing the computer simulations for 3-D printing revealed previously unidentified features. This photo of a printed model, made on a consumer-grade 3-D printer, shows the interacting winds on top and the spine-like protrusions they form in the months around the stars' closest approach.
Credit: NASA's Goddard Space Flight Center
3-D-printed models of the Eta Carinae supercomputer simulation showing the system at apastron (left), periastron (center), and three months after periastron, when finger-like protrusions are prominent in the interaction region.
Ccredit: NASA's Goddard Space Flight Center
Another view of a 3-D-printed model, showing the interacting winds (top) three months after the stars' closest approach and the newly identified protrusions they form.
Credit: NASA's Goddard Space Flight Center
A collection of 3-D-printed models of a new supercomputer simulation tracking the interacting winds of Eta Carinae. In the foreground, the interaction region (left) is seen three months after the stars' closest approach, when newly identified spine-like protrusions form along a cavity created in the primary star's wind.
Credit: NASA's Goddard Space Flight Center
For More Information
Credits
Please give credit for this item to:
NASA's Goddard Space Flight Center. However individual items should be credited as indicated above.
-
Producer
- Scott Wiessinger (USRA)
-
Scientists
- Thomas Madura (ORAU)
- Theodore Gull (NASA/GSFC)
-
Animators
- Thomas Madura (ORAU)
- Brian Monroe (USRA)
-
Narrator
- Scott Wiessinger (USRA)
-
Video editor
- Scott Wiessinger (USRA)
-
Writers
- Francis Reddy (Syneren Technologies)
- Scott Wiessinger (USRA)
Series
This page can be found in the following series:Tapes
The media on this page originally appeared on the following tapes:-
Eta Carinae Inner Workings
(ID: 2015001)
Tuesday, January 6, 2015 at 5:00AM
Produced by - Robert Crippen (NASA)
Datasets used
-
[Swift]
ID: 217 -
[Suzaku]
ID: 692 -
[Hubble Space Telescope]
ID: 831
Note: While we identify the data sets used on this page, we do not store any further details, nor the data sets themselves on our site.
Related
- ID: 11936
 Produced Video
 - ID: 11722
 Produced Video
 - ID: 11568
 Produced Video
Release date
This page was originally published on Wednesday, January 7, 2015.
This page was last updated on Wednesday, May 3, 2023 at 1:50 PM EDT.