A newer version of this visualization is available.
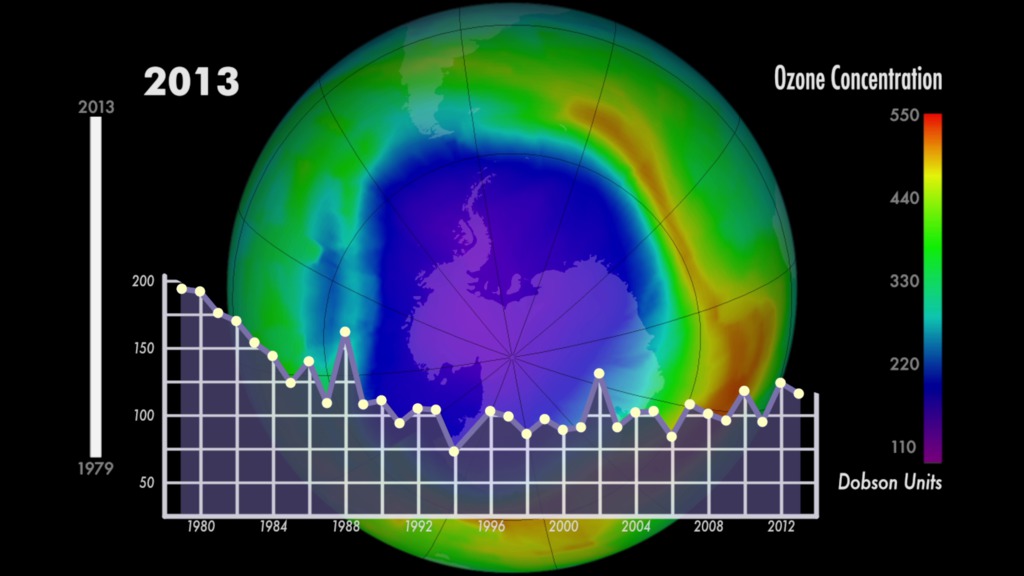
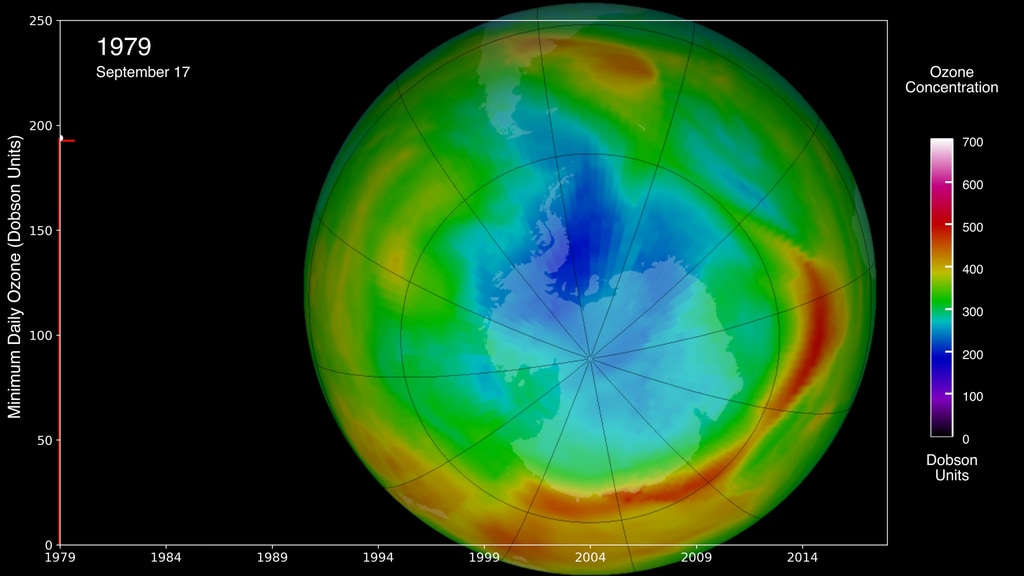
Ozone minimum concentrations, 1979-2013
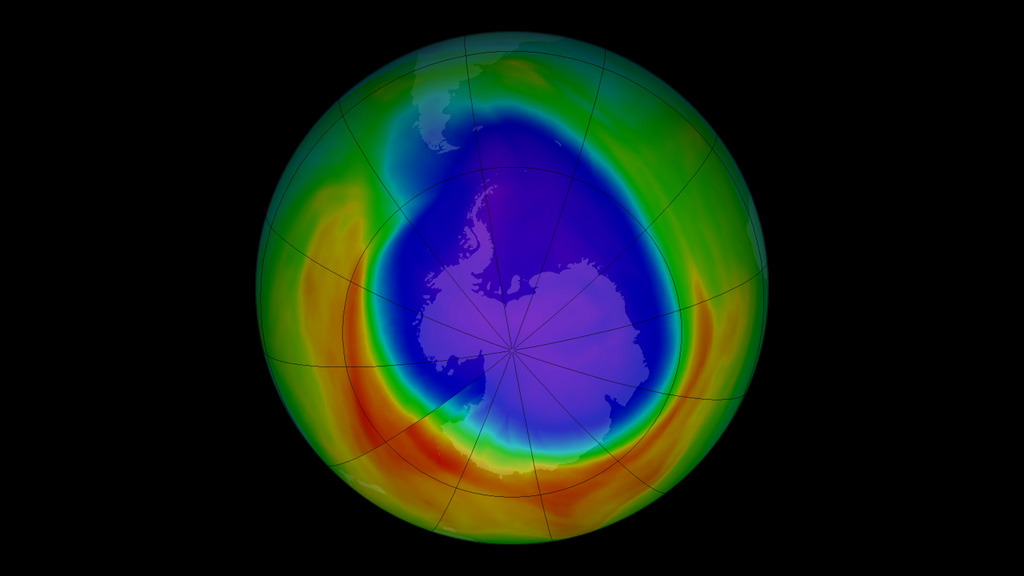
Visualizations of ozone concentrations over the southern hemisphere.
Data is from ozonewatch.gsfc.nasa.gov
Minimum concentration of ozone in the southern hemisphere for each year from 1979-2013 (there is no data from 1995). Each image is the day of the year with the lowest concentration of ozone. A graph of the lowest ozone amount for each year is shown.
Data is taken from http://ozonewatch.gsfc.nasa.gov/.Minimum concentration of ozone in the southern hemisphere for each year from 1979-2013 (there is no data from 1995). Each image is the day of the year with the lowest concentration of ozone.
Data is taken from http://ozonewatch.gsfc.nasa.gov/.The daily amount of ozone in the southern hemisphere for 2014, from July 1 to September 6.
Data is taken from http://ozonewatch.gsfc.nasa.gov/.Credits
Please give credit for this item to:
NASA's Goddard Space Flight Center
-
Animator
- Matthew R. Radcliff (USRA)
-
Video editor
- Matthew R. Radcliff (USRA)
-
Producer
- Matthew R. Radcliff (USRA)
-
Project support
- Aaron E. Lepsch (ADNET Systems, Inc.)
Series
This page can be found in the following series:Tapes
The media on this page originally appeared on the following tapes:-
Ozone minimums 1979-2013
(ID: 2014085)
Wednesday, September 10, 2014 at 4:00AM
Produced by - Walt Feimer (HTSI)
Related papers
Related
- ID: 11644
 Produced Video
 - ID: 11656
 Produced Video
Newer Versions
- ID: 30889
 Hyperwall Visual
Release date
This page was originally published on Wednesday, September 10, 2014.
This page was last updated on Wednesday, May 3, 2023 at 1:50 PM EDT.