Visualizing Big Data
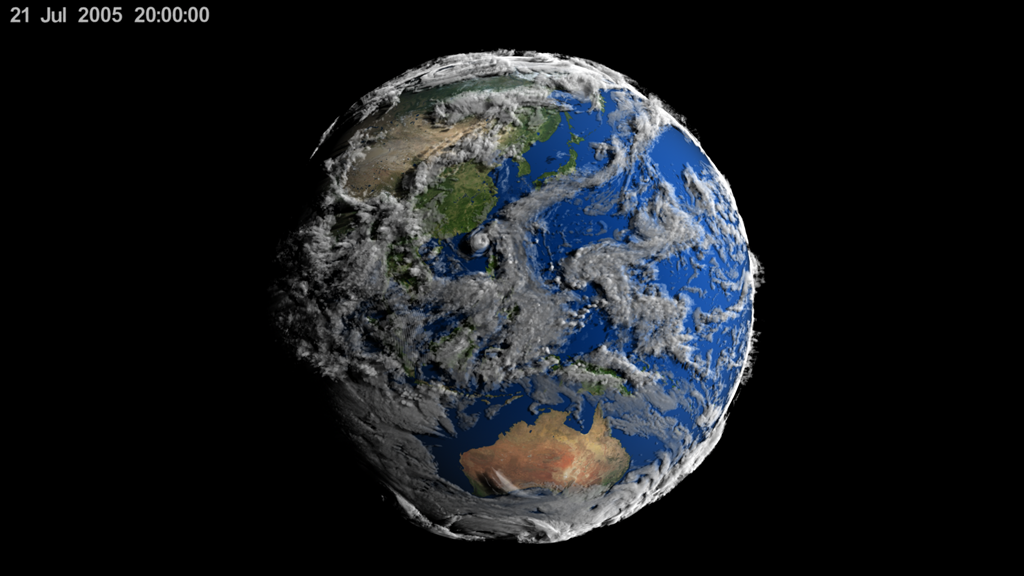
Clouds bend and swirl into a massive Category 4 typhoon that spins toward China. Luckily the storm only exists inside the mind of a supercomputer. The artificial storm is seen in a new visualization of Earth’s atmosphere that’s based on an extremely high-resolution supercomputer simulation created by NASA’s Goddard Earth Observing System Model, Version 5 (GEOS-5). The model uses data to generate virtual scenes that mimic the natural world. Seeded with observations that include sea surface temperatures, industrial emissions and volcanic eruptions, the model simulated clouds around the globe over a two-year period from 2005 to 2007. Watch the video to see a sample of the results.

Scientists explore Earth using supercomputers.
This visualization shows simulated clouds from July 16-24, 2005.
Each second of the visualization contains 15 billion 3D pixels called voxels.
The atmosphere has been exaggerated 25 times in the visualization to show fine details in the cloud layers.
The simulation produced 5 million gigabytes of data, of which only a fraction was used to create the visualization.
The simulation was run on the Discover supercomputer (above) at the NASA Center for Climate Simulation.
Credits
Please give credit for this item to:
NASA's Scientific Visualization Studio
Supercomputer image courtesy of NASA/GSFC/Pat Izzo
-
Animators
-
Greg Shirah
(NASA/GSFC)

- Trent L. Schindler (USRA)
-
Greg Shirah
(NASA/GSFC)
-
Scientist
- William Putman (NASA/GSFC)
-
Project support
- Laurence Schuler (ADNET Systems, Inc.)
- Ian Jones (ADNET Systems, Inc.)
-
Writer
- Patrick Lynch (Wyle Information Systems)
Related
- ID: 4180
 Visualization
Release date
This page was originally published on Thursday, September 4, 2014.
This page was last updated on Wednesday, May 3, 2023 at 1:50 PM EDT.