Monitoring Air Quality
Airborne pollutants can negatively affect our health. Such molecules can flow from city to city via wind, building a river of smog as evident around our nation’s Northeast Corridor and over flatter terrain in the eastern U.S. One major air pollutant is nitrogen dioxide, a brownish gas commonly emitted from motor vehicle exhaust and power plants. This noxious chemical causes respiratory issues and promotes the formation of other harmful air pollutants like ground-level ozone. Observations by the Ozone Monitoring Instrument aboard NASA’s Aura satellite show that nitrogen dioxide levels have actually decreased nationwide by four percent per year since 2005. The decline is thought to stem partly from technology improvements, especially in the energy and transportation sectors. Watch the video to see changes in nitrogen dioxide levels across the U.S. from 2005 to 2011.

NASA satellite data shows the air we breathe is getting cleaner.
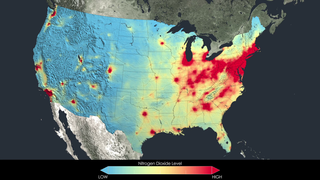
Nitrogen dioxide levels across the U.S. from 2005 to 2011 can be seen in this video. Red represents areas with high concentrations; blue is low.
New York City, the nation’s most populous city, saw a 32 percent decrease in nitrogen dioxide between the 2005-2007 and 2009-2011 periods.
The San Francisco Bay Area saw some reduction in nitrogen dioxide between the 2005-2007 and 2009-2011 periods.
Emission control devices on power plants helped Atlanta reduce nitrogen dioxide levels by 42 percent between the 2005-2007 and 2009-2011 periods.
Nitrogen dioxide levels in Chicago decreased by 43 percent between the 2005-2007 and 2009-2011 periods.
In Denver, a 22 percent decrease in nitrogen dioxide was seen between the 2005-2007 and 2009-2011 periods.
For More Information
See NASA.gov
Credits
Please give credit for this item to:
NASA's Scientific Visualization Studio
-
Animator
- Trent L. Schindler (USRA)
-
Producer
- Kayvon Sharghi (USRA)
-
Scientists
- Bryan Duncan (NASA/GSFC)
- Lok Lamsal (USRA)
- Yasuko Yoshida (SSAI)
-
Writer
- Kasha Patel (Wyle Information Systems)
Related
- ID: 11579
Release date
This page was originally published on Thursday, June 26, 2014.
This page was last updated on Wednesday, May 3, 2023 at 1:50 PM EDT.