SDO: Year 3
- Visualizations by:
- Tom Bridgman
- View full credits
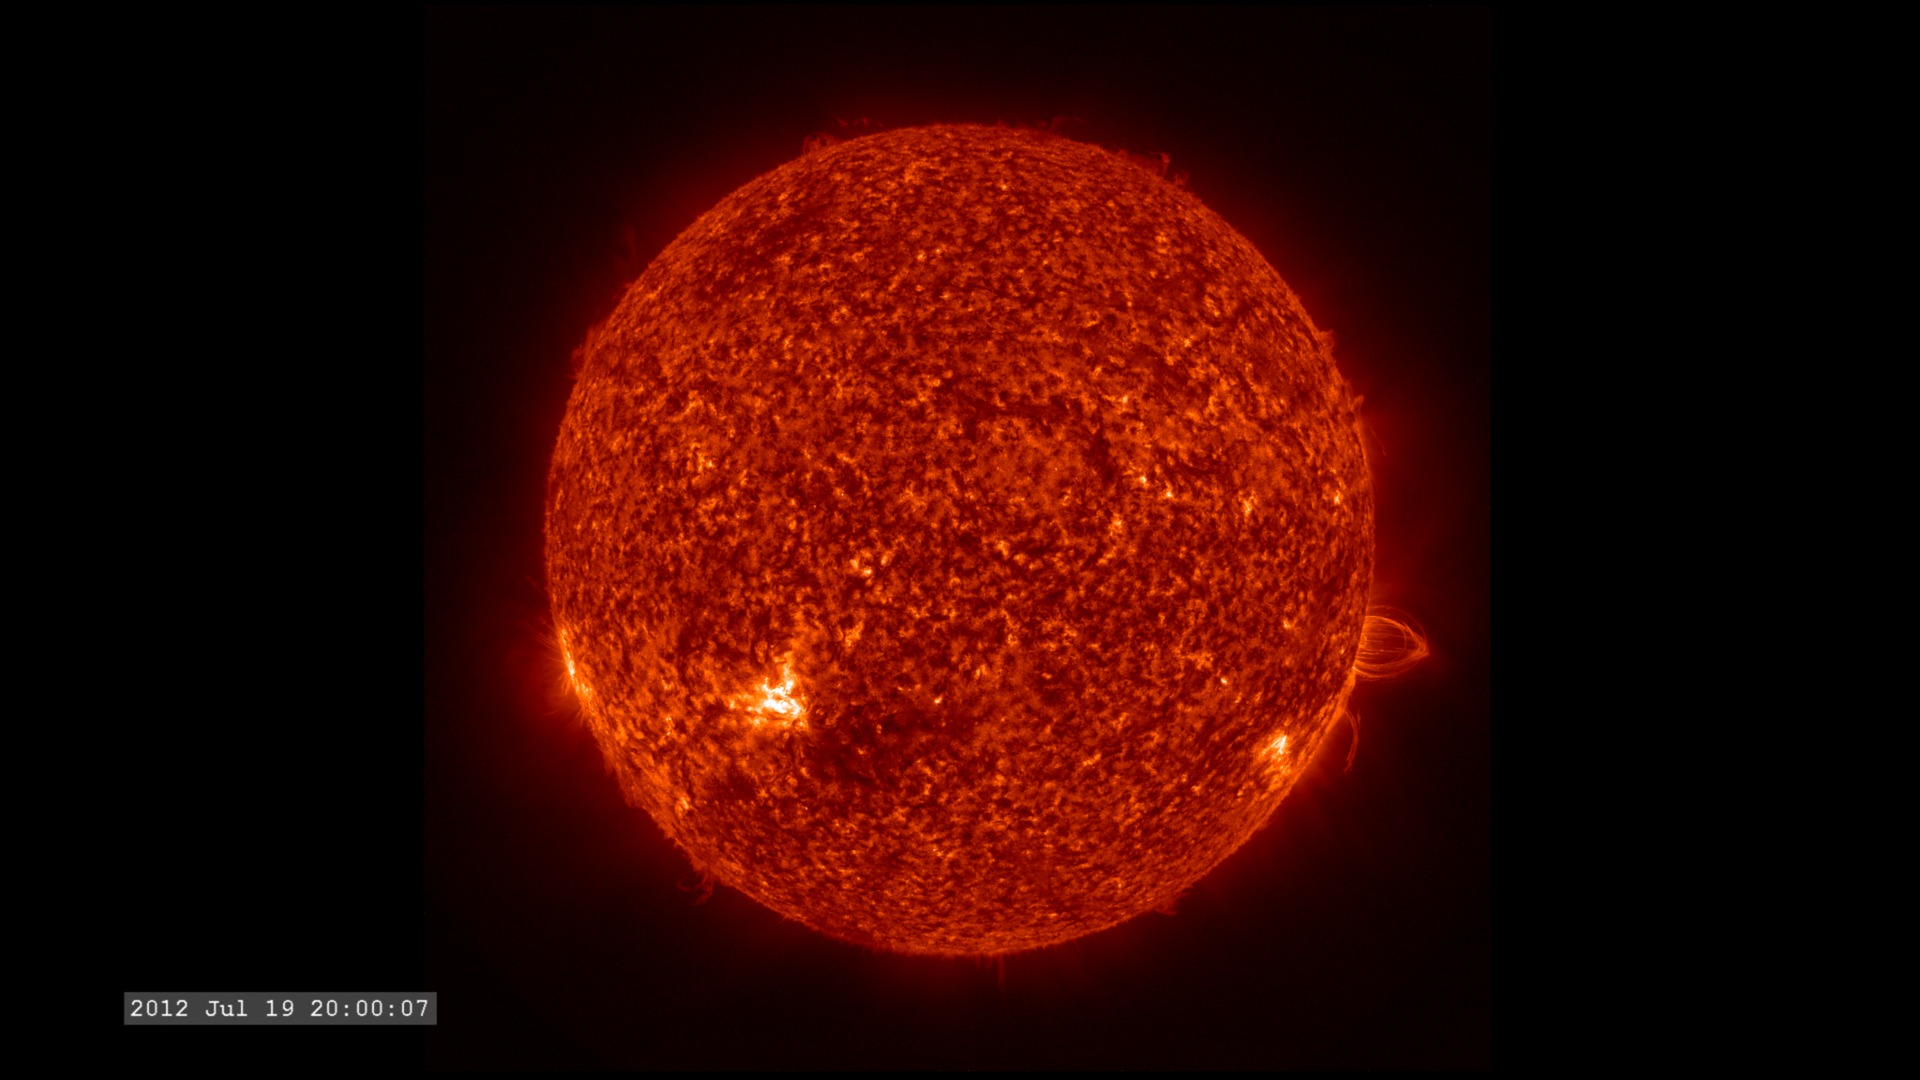
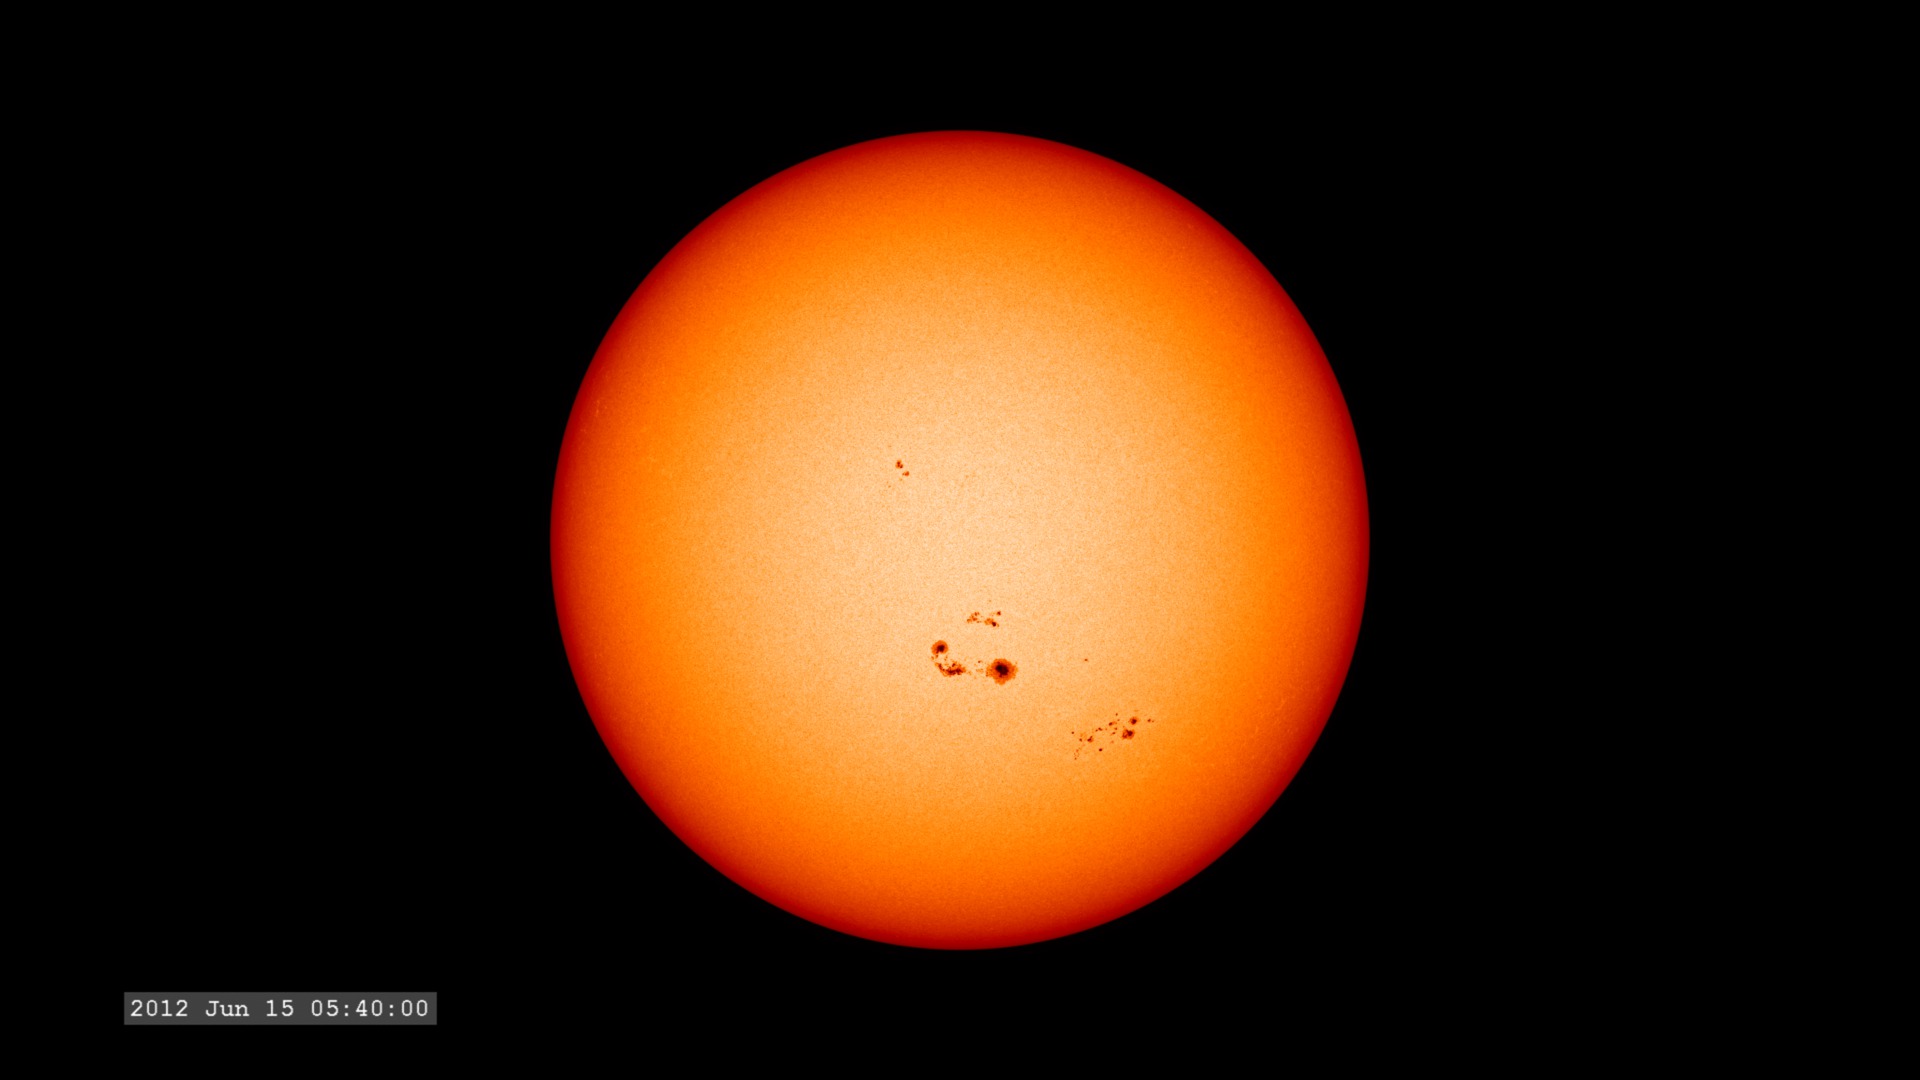
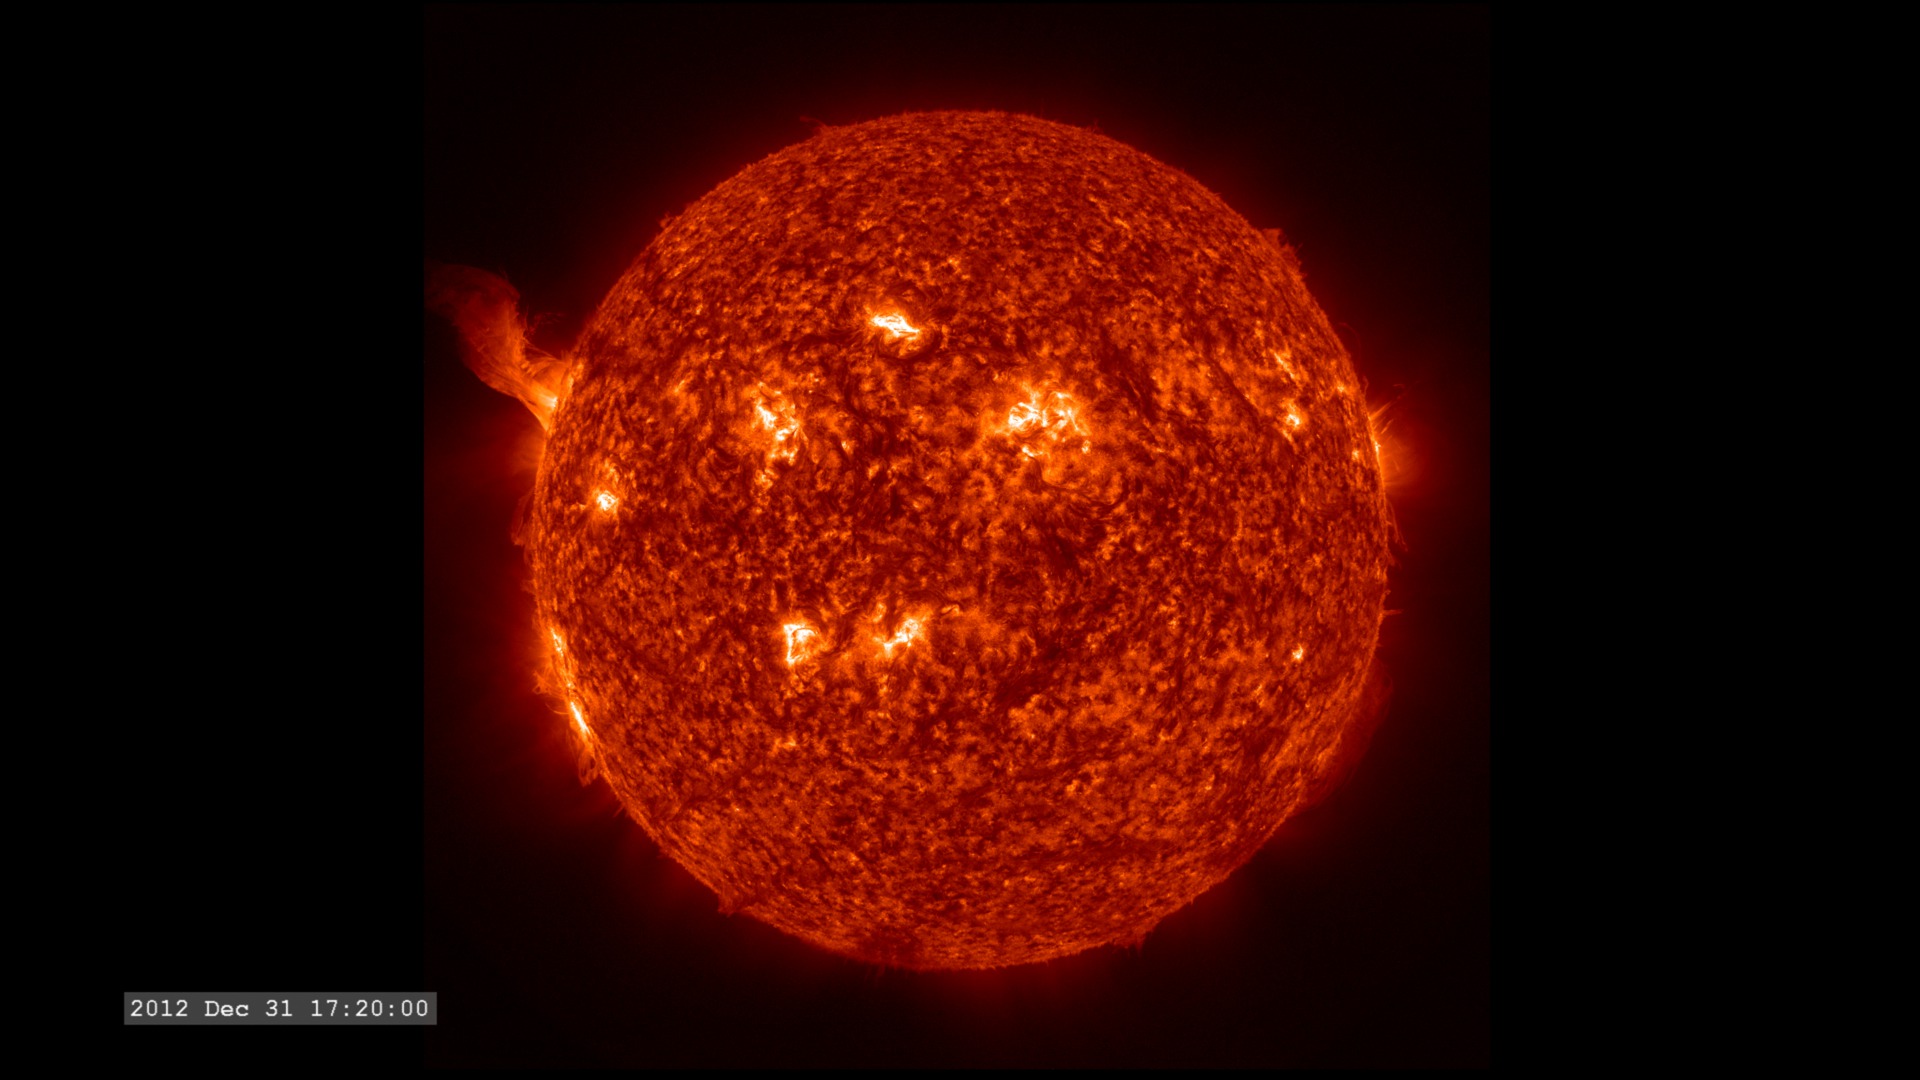
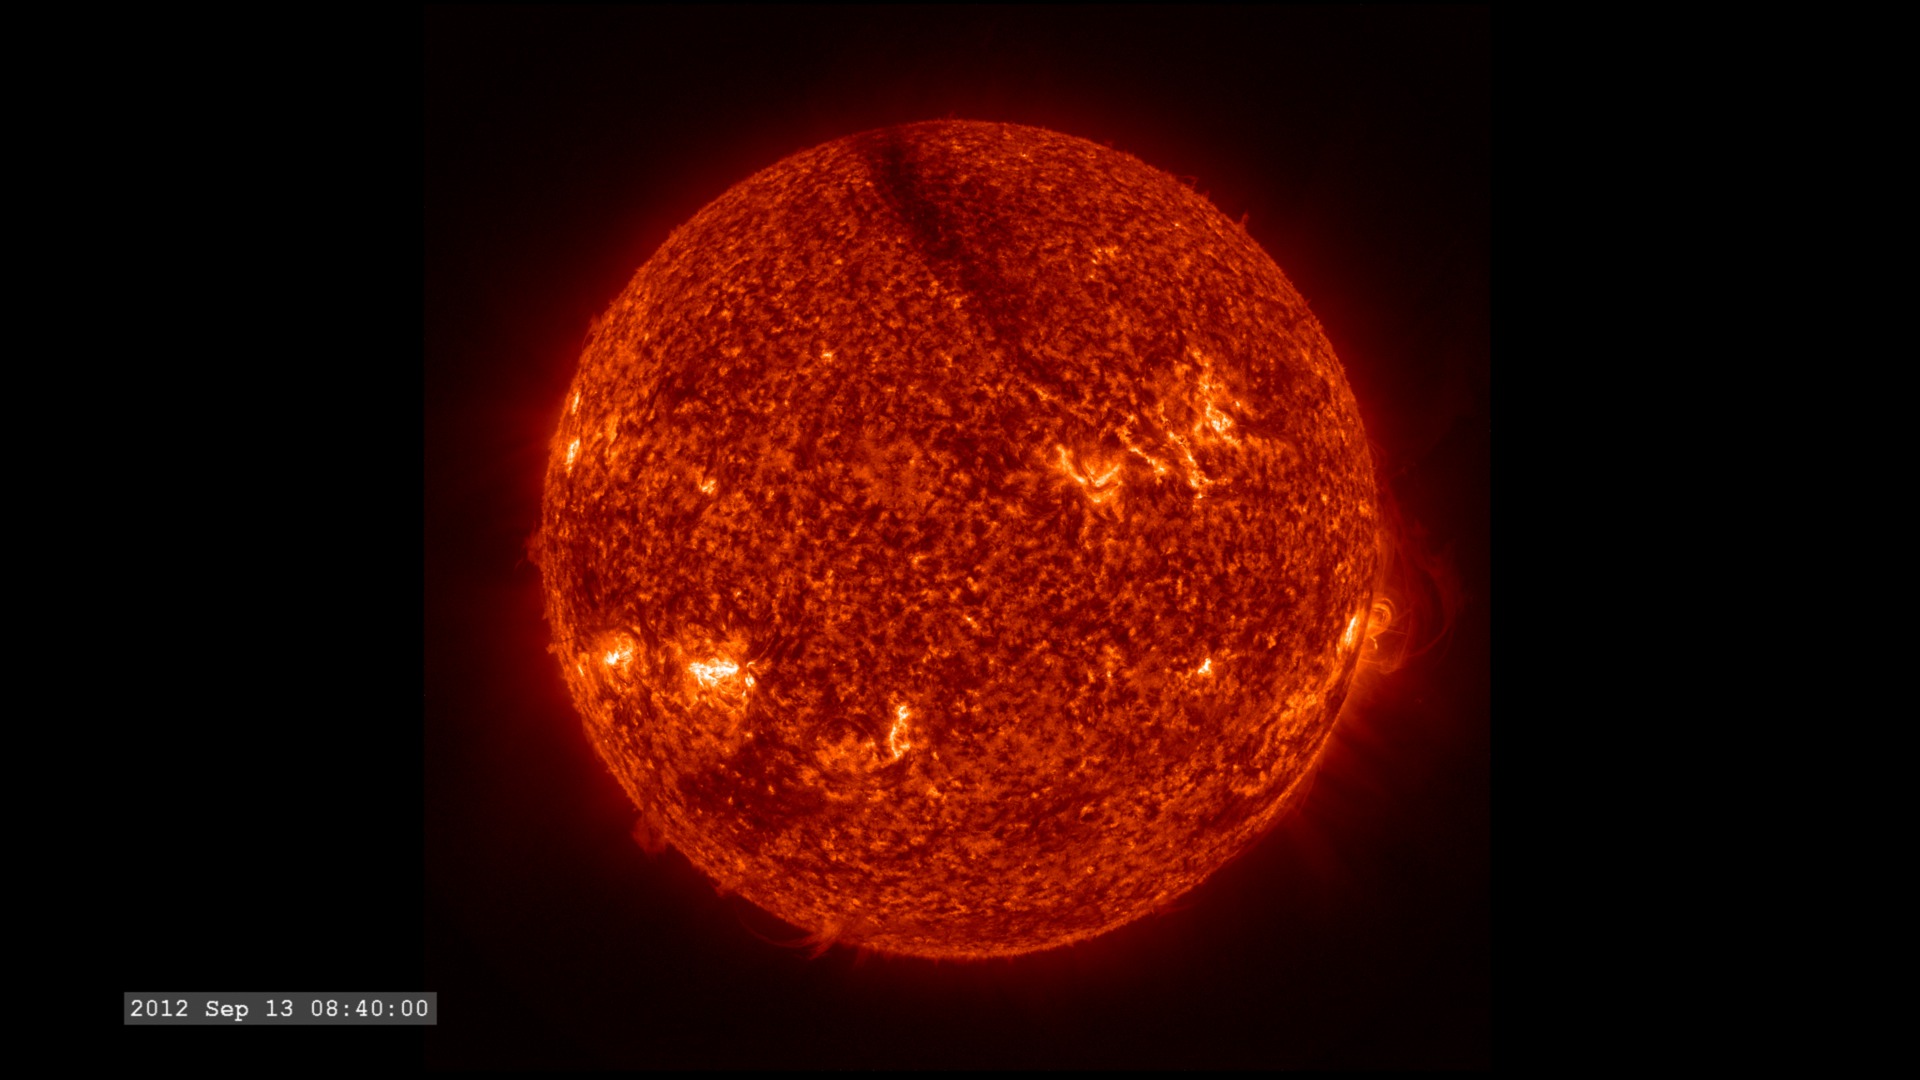
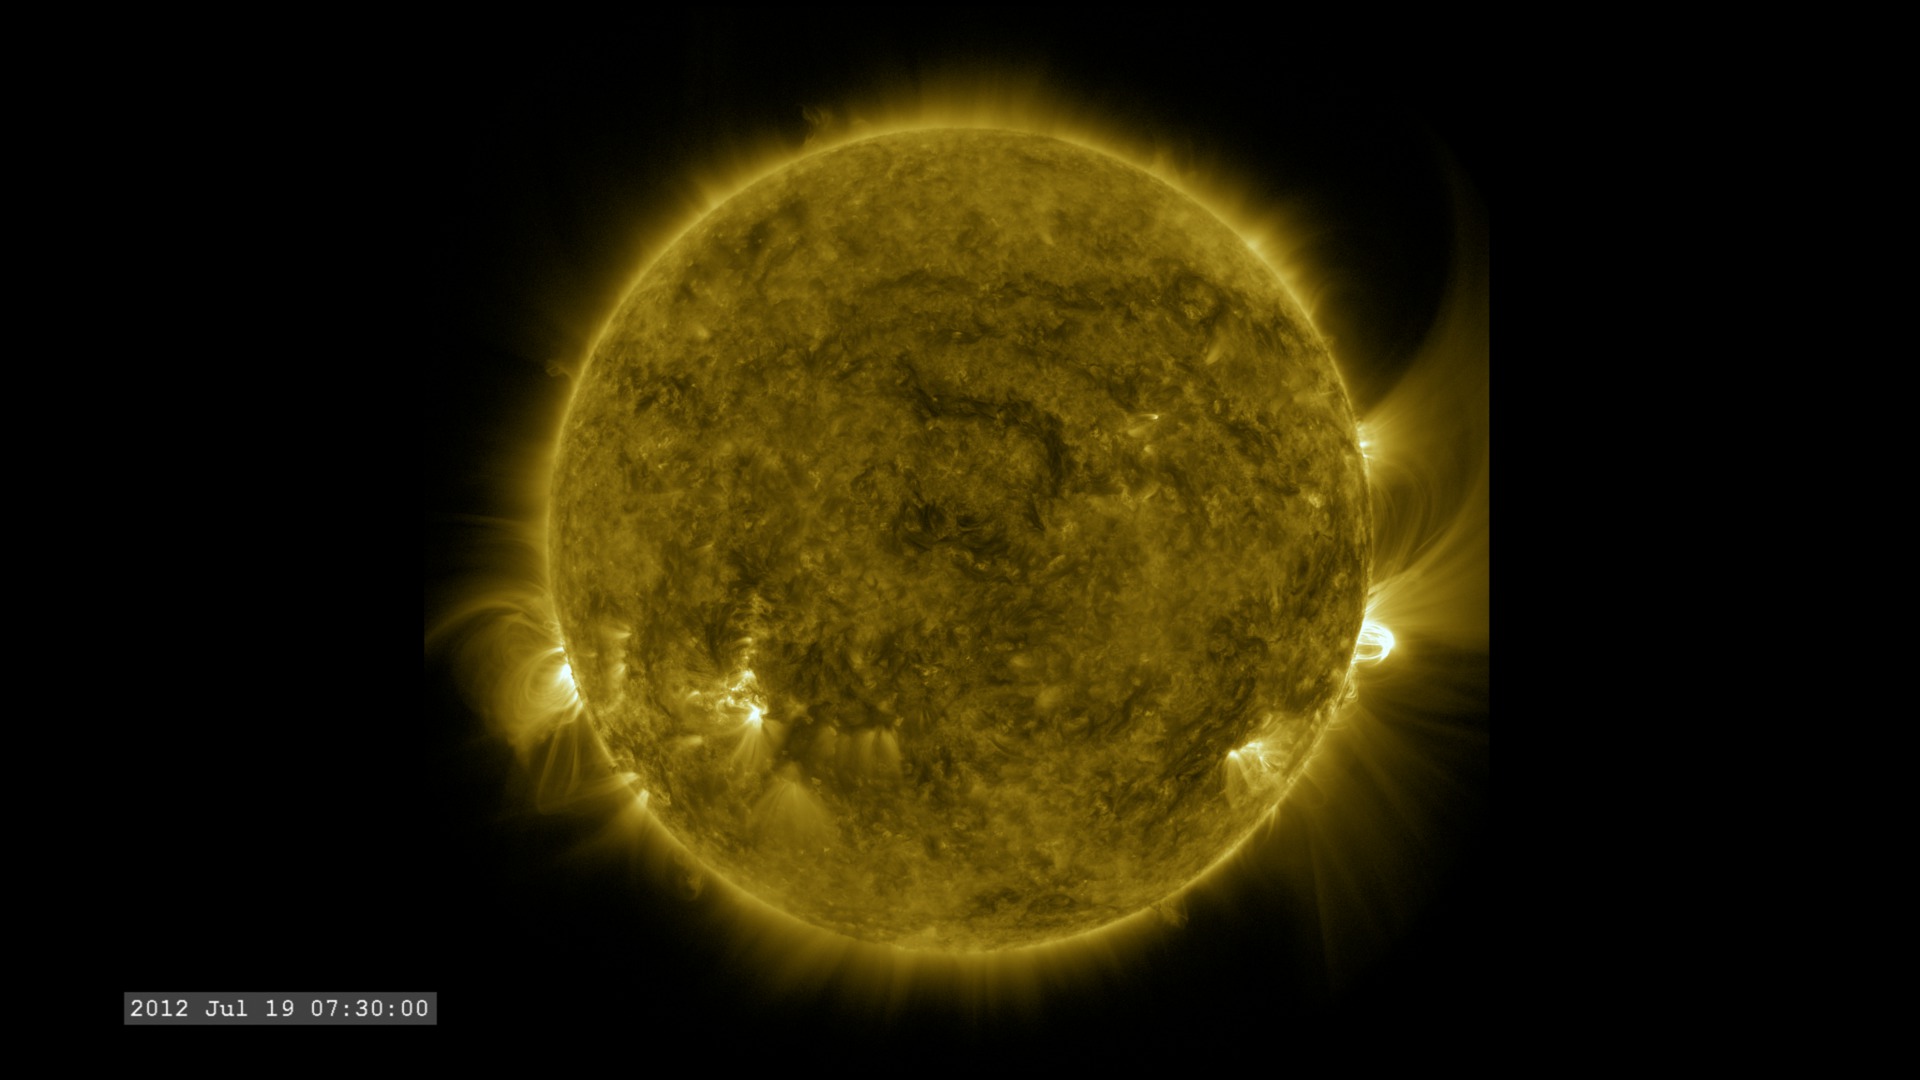
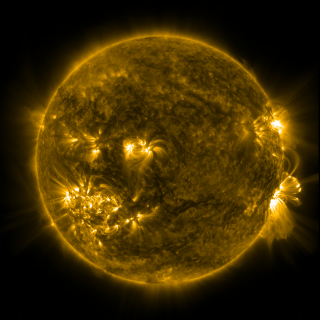
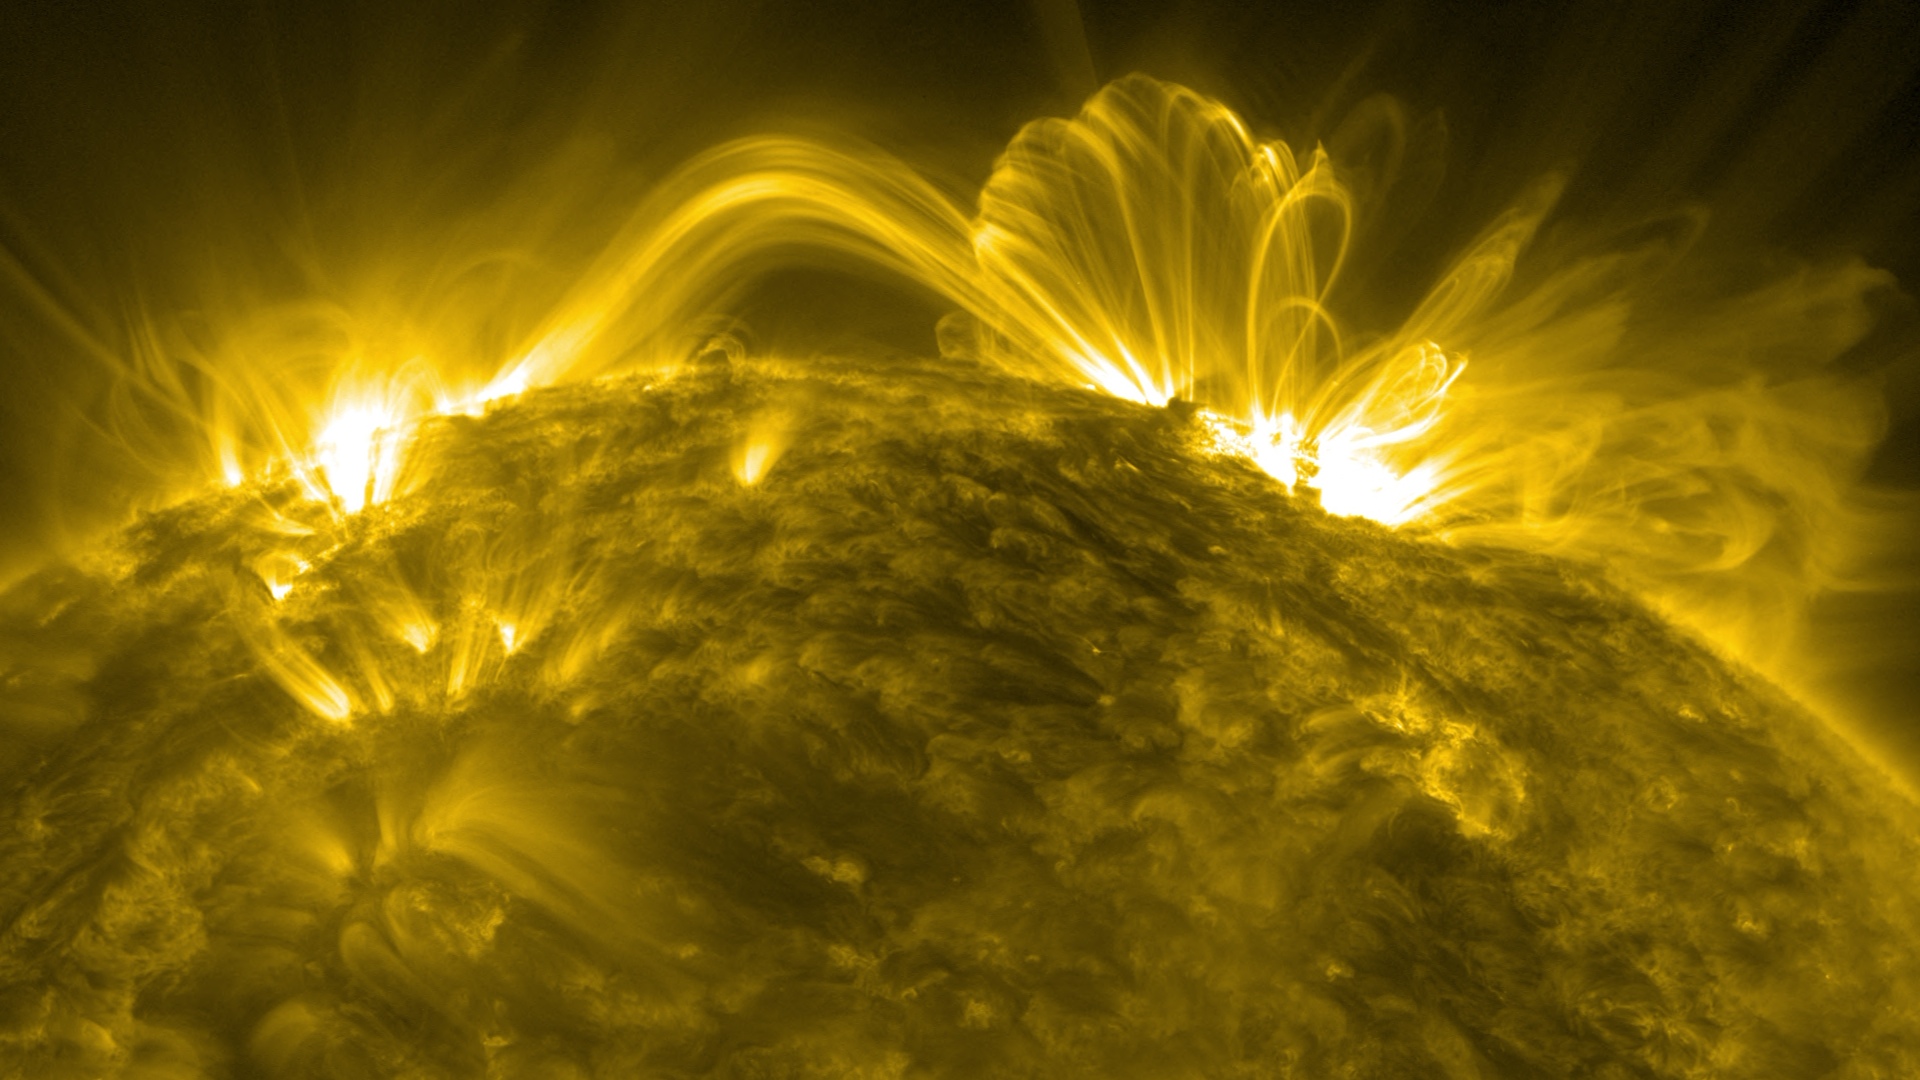
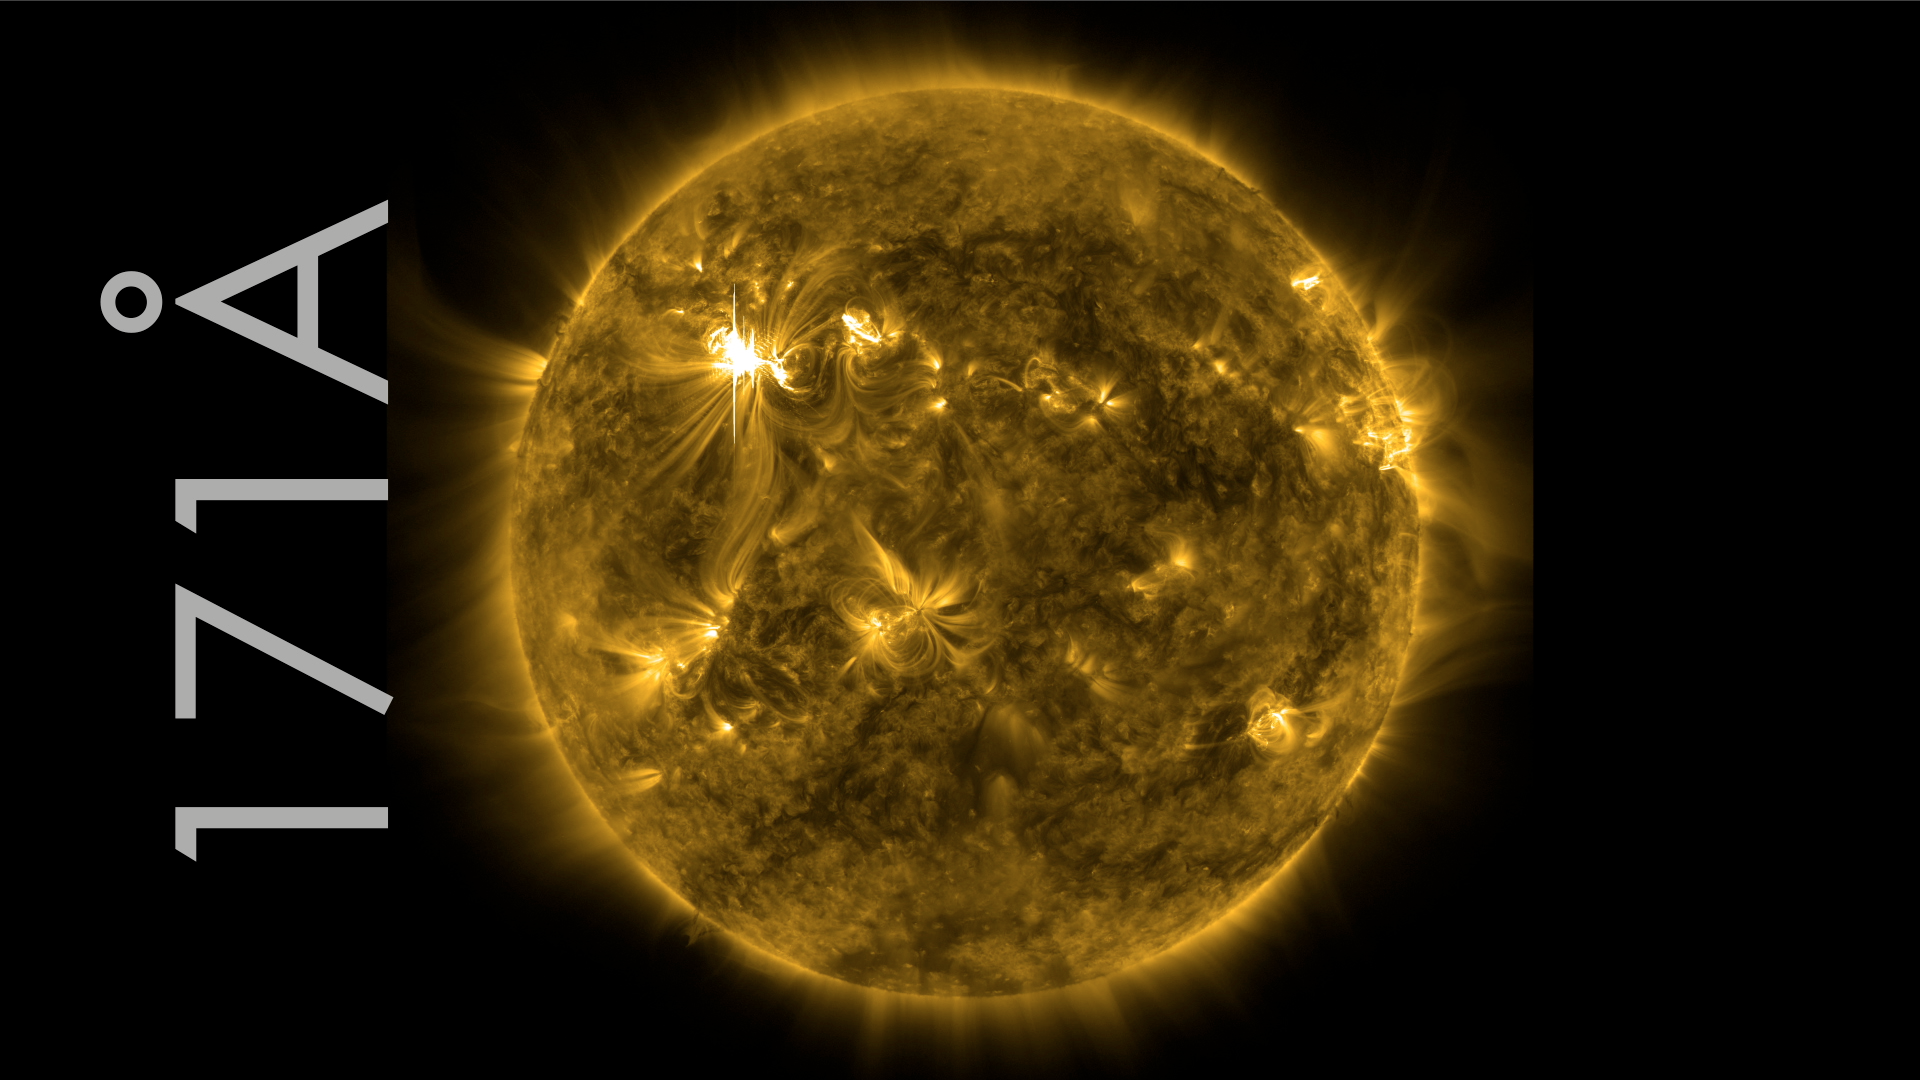
When the science team released its first images in April of 2010, SDO's data exceeded everyone's hopes and expectations, providing stunningly detailed views of the sun. In the three years since then, SDO's images have continued to show breathtaking pictures and movies of eruptive events on the sun. Such imagery is more than just pretty, they are the very data that scientists study. By highlighting different wavelengths of light, scientists can track how material on the sun moves. Such movement, in turn, holds clues as to what causes these giant explosions, which, when Earth-directed, can disrupt technology in space.
SDO is the first mission in a NASA's Living With a Star program, the goal of which is to develop the scientific understanding necessary to address those aspects of the sun-Earth system that directly affect our lives and society. NASA's Goddard Space Flight Center in Greenbelt, Md. built, operates, and manages the SDO spacecraft for NASA's Science Mission Directorate in Washington, D.C.
SDO: Year One here.
SDO: Year 2 here.
Information about the individual clips used in this video is here.
Watch this video on YouTube.
Movies
- G2013-019_SDO_Year_3_FINAL_appletv.m4v (960x540) [109.4 MB]
- G2013-019_SDO_Year_3_FINAL_appletv.webmhd.webm (960x540) [56.5 MB]
- 11203_SDO_Year_3_H264_1920x1080_29.97.mov (1280x720) [101.4 MB]
- G2013-019_SDO_Year_3_FINAL_1280x720.wmv (1280x720) [129.5 MB]
- G2013-019_SDO_Year_3_FINAL_youtube_hq.mov (1280x720) [138.4 MB]
- 11203_SDO_Year_3_ProRes_1920x1080_29.97.mov (1920x1080) [3.7 GB]
- 11203_SDO_Year_3_H264_Best_1920x1080_29.97.mov (1920x1080) [4.4 GB]
- 11203_SDO_Year_3_H264_Good_1920x1080_29.97.mov (1920x1080) [1.3 GB]
- 11203_SDO_Year_3_MPEG4_1920x1080_29.97.mp4 (1920x1080) [251.1 MB]
- G2013-019_SDO_Year_3_FINAL_Portal.mov (640x360) [108.0 MB]
- G2013-019_SDO_Year_3_FINAL_ipod_lg.m4v (640x360) [43.8 MB]
- G2013-019_SDO_Year_3_FINAL_ipod_sm.mp4 (320x240) [23.7 MB]
Images
- SDO_Year_3_Title_Still.jpg (1920x1080) [136.1 KB]
- SDO_Year_3_Title_Still_web.png (320x180) [15.3 KB]
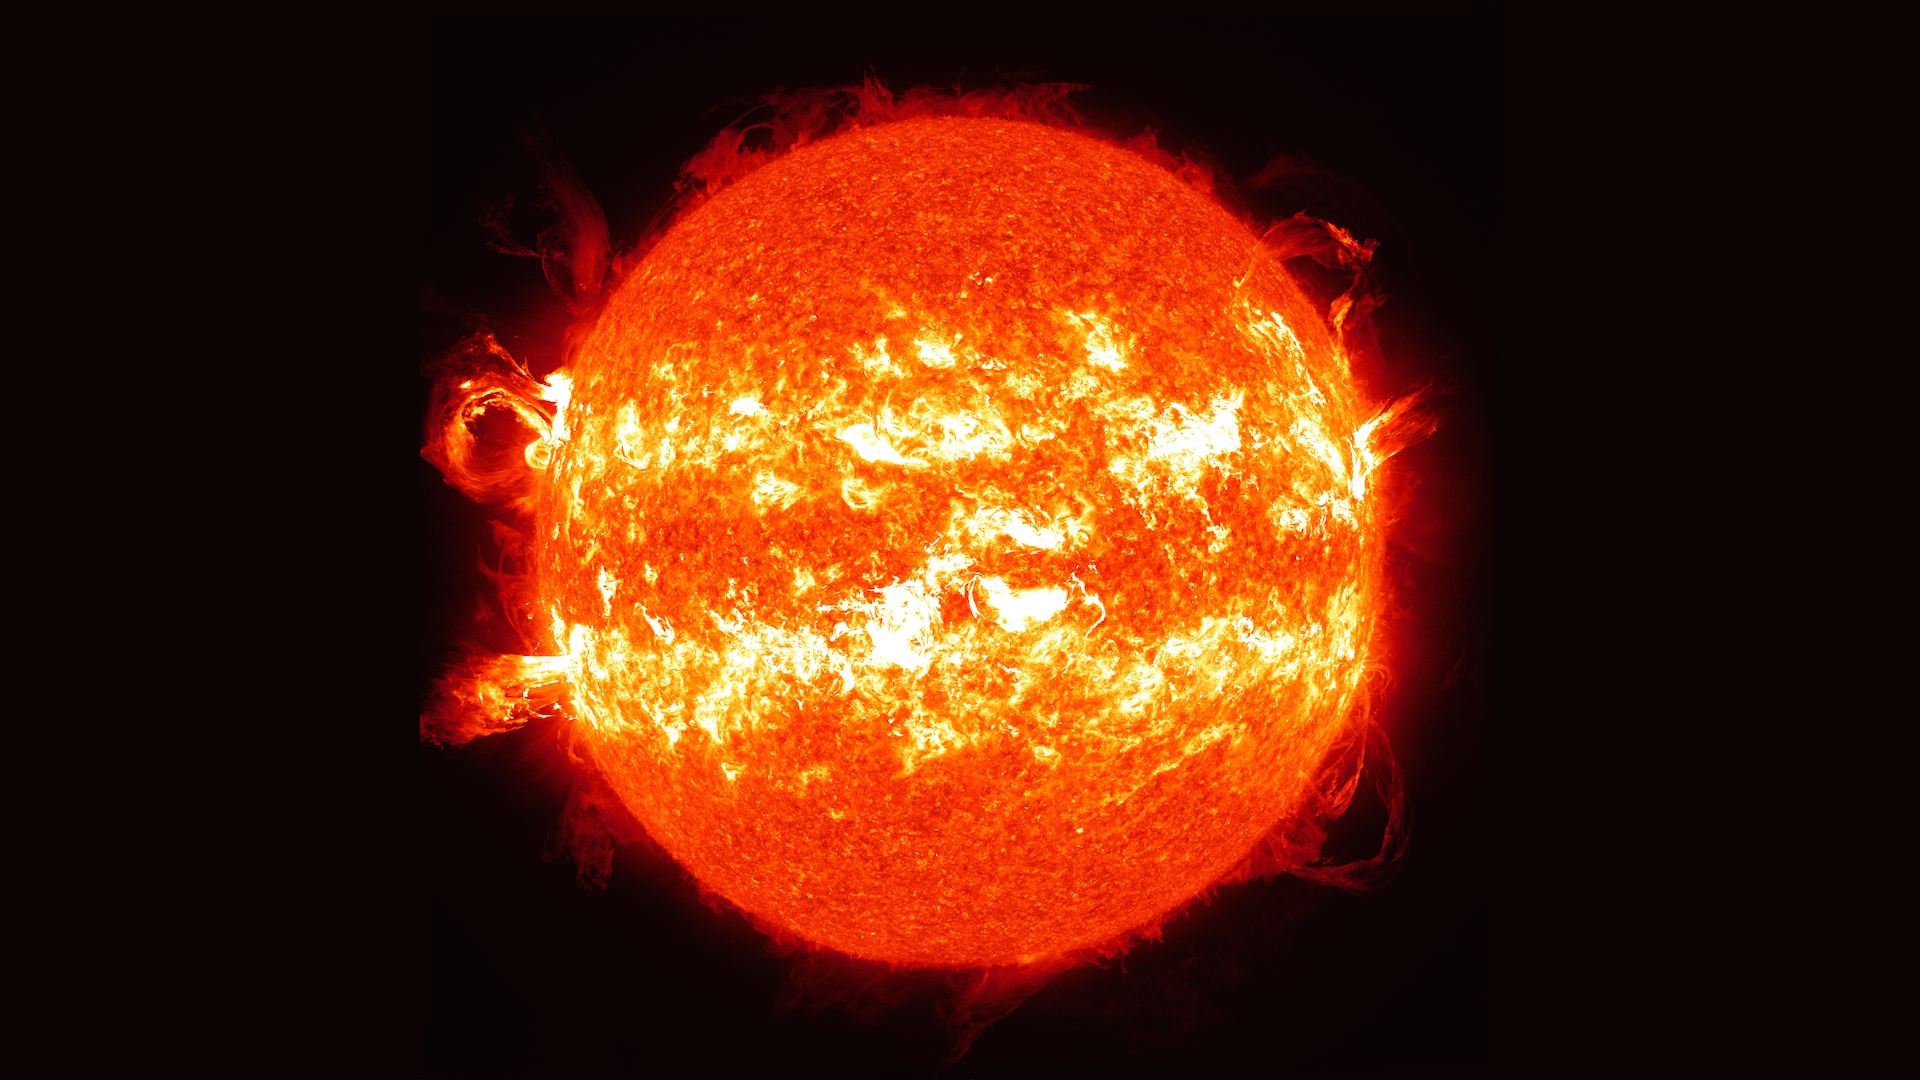
The sun's greatest hits as captured by the Solar Dynamic Observatory from February 2012 to February 2013.
Music: Mistake (Davide Rossi Re-Work - Instrumental) courtesy of Moby Gratis.
For complete transcript, click here.

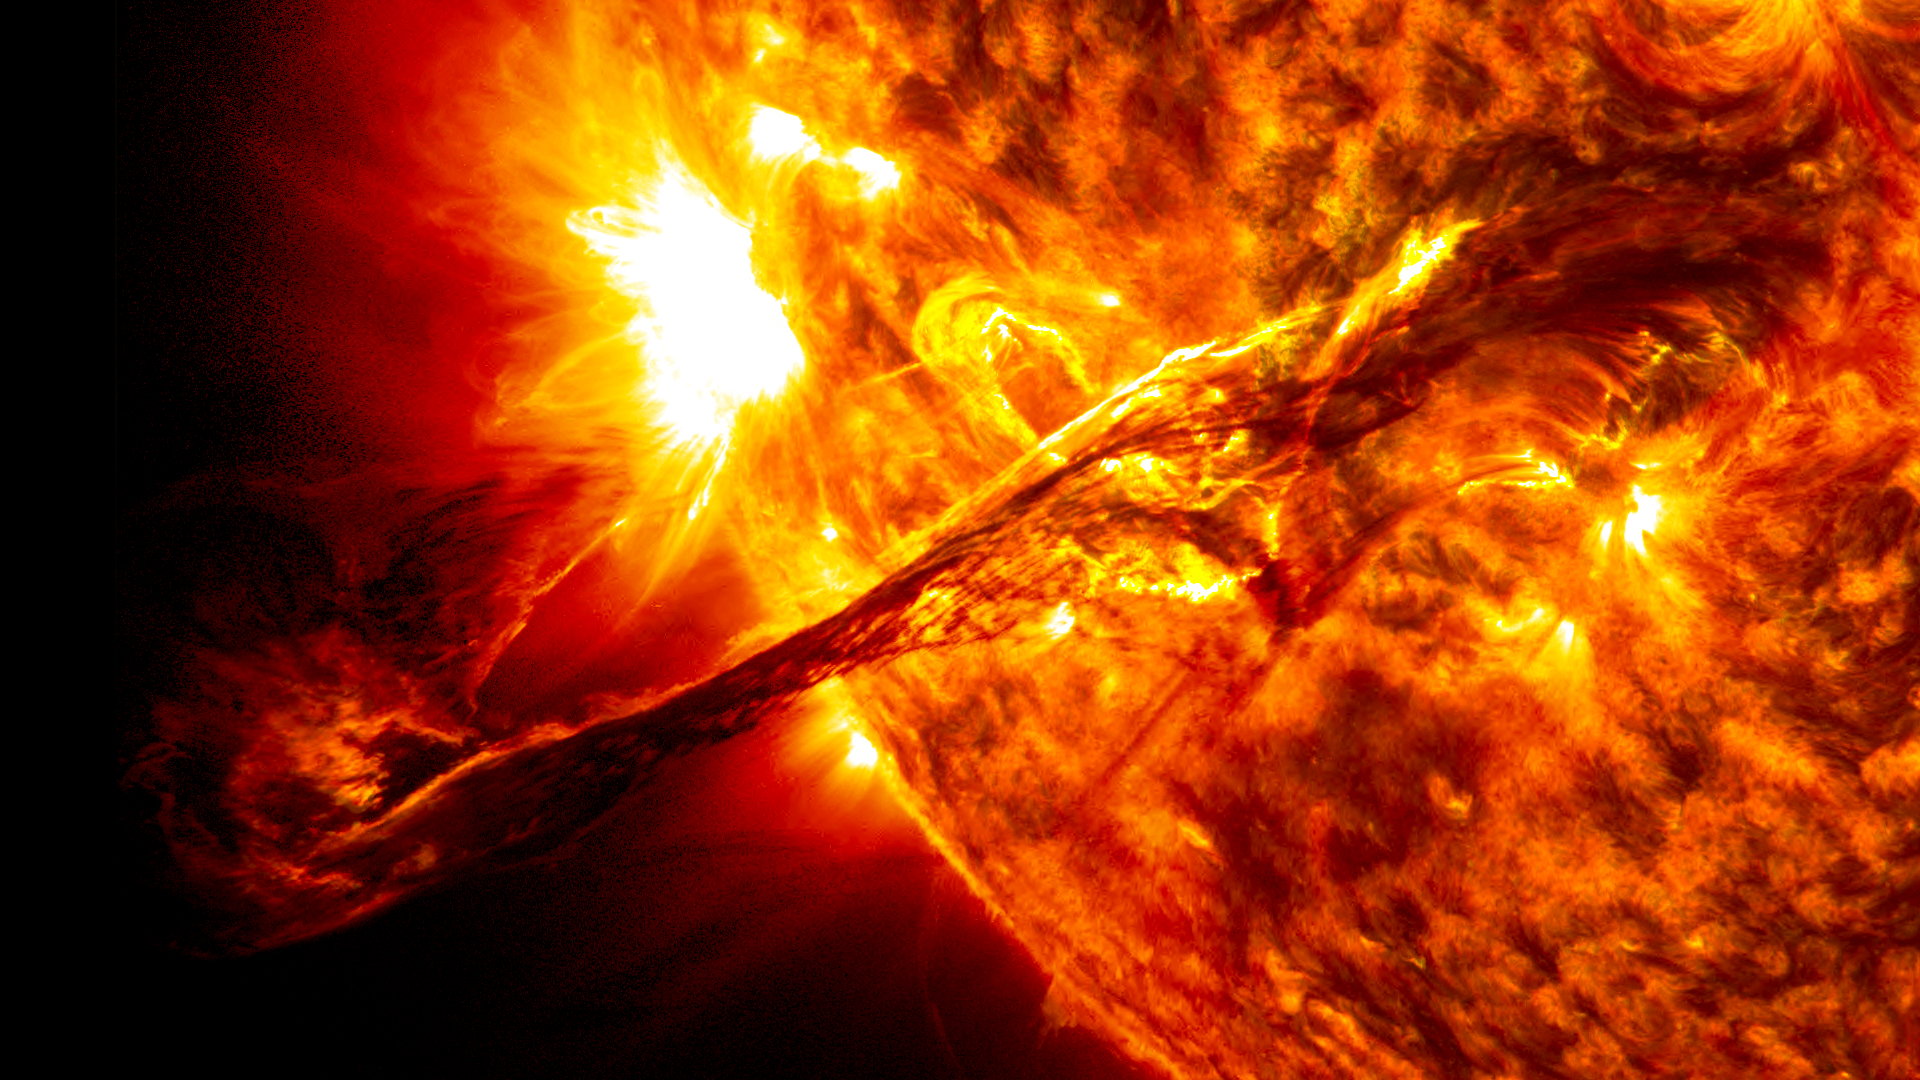
Blended 131 angstrom and 171 angstrom images of July 19, 2012 flare and CME.

Blended images in 304 and 171 angstrom wavelength light of August 31, 2012 prominence eruption and CME.

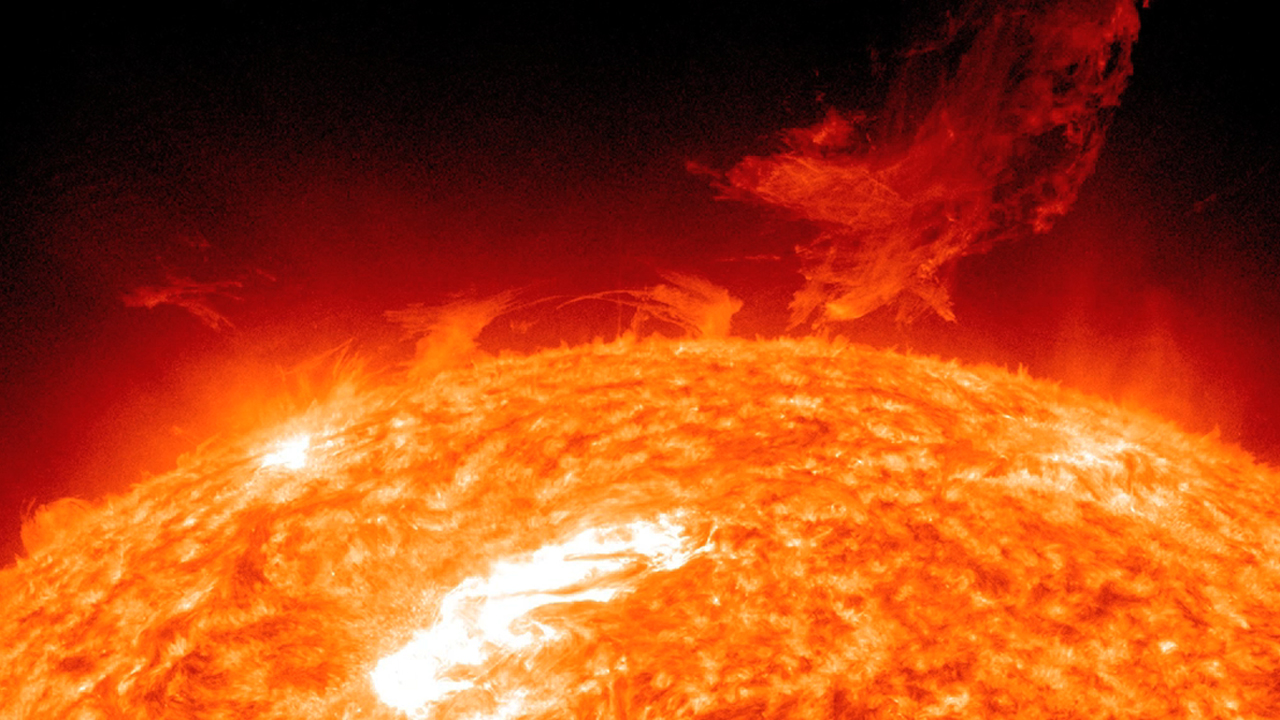
December 31, 2012 prominence in 304 angstrom light.
For More Information
See http://www.nasa.gov/mission_pages/sdo/news/sdo-year3.html
Credits
Please give credit for this item to:
NASA's Goddard Space Flight Center/SDO
Animators
- Tom Bridgman (GST) [Lead]
- Scott Wiessinger (KBRwyle)
Writers
- Karen Fox (ADNET)
- Scott Wiessinger (KBRwyle)
Video editor
- Scott Wiessinger (KBRwyle)
Producer
- Scott Wiessinger (KBRwyle)
Narrator
- Karen Fox (ADNET)
Missions
This visualization is related to the following missions:Series
This visualization can be found in the following series:Tapes
This visualization originally appeared on the following tapes:- None
Datasets used in this visualization
SDO
Dataset can be found at: http://sdo.gsfc.nasa.gov/
See more visualizations using this data setSDO AIA 131 (A.K.A. 131 Filter) (Collected with the AIA sensor)
Dataset can be found at: http://jsoc.stanford.edu/
See more visualizations using this data setSDO AIA 171 (A.K.A. 171 Filter) (Collected with the AIA sensor)
Dataset can be found at: http://jsoc.stanford.edu/
See more visualizations using this data setSDO AIA 193 (A.K.A. 193 Filter) (Collected with the AIA sensor)
Dataset can be found at: http://jsoc.stanford.edu/
See more visualizations using this data setSDO AIA 211 (A.K.A. 211 Filter) (Collected with the AIA sensor)
Dataset can be found at: http://jsoc.stanford.edu/
See more visualizations using this data setSDO AIA 304 (A.K.A. 304 Filter) (Collected with the AIA sensor)
Dataset can be found at: http://jsoc.stanford.edu/
See more visualizations using this data setSDO AIA 335 (A.K.A. 335 Filter) (Collected with the AIA sensor)
Dataset can be found at: http://jsoc.stanford.edu/
See more visualizations using this data setSDO SDO Continuum (A.K.A. Continuum) (Collected with the HMI sensor)
Note: While we identify the data sets used in these visualizations, we do not store any further details nor the data sets themselves on our site.
Related pages
Rare Total Solar Eclipse Is Only Two Months Away Live Shots 6.21.17
June 13th, 2017
Read moreB-roll for the live shots Canned interview with NASA Scientist Dr. Nicholeen Viall looking off camera. Soundbites are separated by slates. Includes transcript of soundbites. Canned interview in Spanish with Dr. Yari Collado-Vega. Soundbites are separated with slates Soundbites with Drs. Alex Young and Noah Petro. TRT 5:41. Includes full transcript with timecodes The Countdown is on for Rare Solar Eclipse Visible Across all of North AmericaFor the First Time in Nearly 100 Years, Millions of Americans Coast-to-Coast Will see an Eclipse Chat with NASA to find out how you can catch this spectacular eventOn August 21, 2017, daylight will fade to the level of a moonlit night as millions of Americans experience one of nature’s most awe-inspiring shows – a total solar eclipse. For the first time since 1918, the dark shadow of the moon will sweep coast-to-coast across the United States, putting 14 states in the path of totality and providing a spectacular view of a partial eclipse across all 50 states.NASA scientists are available Wednesday, June 21, from 6:00 a.m. – 12:00 p.m. ET to show your viewers the path of the eclipse, what they need to see it safely and talk about the unprecedented science that will be gathered from one of the most anticipated and widely observed celestial events in history. We’ll also give your viewers a sneak peek of a press conference about the eclipse NASA is having later that day.A solar eclipse happens when a rare alignment of the sun and moon casts a shadow on Earth. NASA knows the shape of the moon better than any other planetary body, and this data allows us to accurately predict the shape of the shadow as it falls on the face of Earth. While everyone in the U.S. will see the eclipse if their local skies are clear, people standing in the path of totality – completely in the moon’s shadow – will see stars and planets become visible in what is normally a sunlit sky. Eclipses provide an unprecedented opportunity for us to see the sun’s faint outer atmosphere in a way that cannot be replicated by current human-made instruments. Scientists believe this region of the sun is the main driver for the sun’s constant outpouring of radiation, known as the solar wind, as well as powerful bursts of solar material that can be harmful to our satellites, orbiting astronauts and power grids on the ground. HD Satellite Coordinates for G17-K18/LO: Galaxy 17 Ku-band Xp 18 Slot Lower | 91.0 ° W Longitude | DL 12051.0 MHz | Vertical Polarity | QPSK/DVB-S | FEC 3/4 | SR 13.235 Mbps | DR 18.2954 MHz | HD 720p | Format MPEG2 | Chroma Level 4:2:0 | Audio Embedded**To book a window contact** / Michelle Handleman / michelle.z.handleman@nasa.gov / 301-286-0918Suggested Questions:1. This is the first time in nearly 100 years that the United States will have the opportunity to see a total solar eclipse coast-to-coast! What will happen on August 21?2. This eclipse will be the most widely observed and shared celestial event in U.S. history. Why are scientists excited for this eclipse?3. Eclipses allow scientists to see the sun’s faint outer atmosphere, which is actually hotter than its surface. What can you tell us about NASA’s upcoming mission that will touch the sun?4. How does NASA’s study of our sun help us explore the solar system?5. How does NASA’s mapping of the moon give us the accurate path of totality?6. Where can we learn more?Live Shot Details:Location: NASA’s Goddard Space Flight Center/Greenbelt, MarylandScientists:Dr. Alex Young / NASA ScientistDr. Nicholeen Viall / NASA ScientistDr. Noah Petro / NASA ScientistDr. Geronimo Villanueva [in Spanish] / NASA ScientistTo learn more visit:Eclipse Across AmericaOn Twitter @NASASun For More InformationSee [https://eclipse2017.nasa.gov/](https://eclipse2017.nasa.gov/) Related pages
SDO: Year 5
Feb. 11th, 2015
Read moreHighlights from the Solar Dynamics Observatory's five years of watching the sun.The music is "Expanding Universe" and "Facing the Unknown" both from Killer Tracks.Watch this video on the NASA Goddard YouTube channel.For complete transcript, click here.Information about the individual clips used in this video is here.Credit: NASA's Goddard Space Flight Center/SDO Large square version of the SDO 5 Year mosaic.Credit: NASA's Goddard Space Flight Center/SDO February 11, 2015 marks five years in space for NASA's Solar Dynamics Observatory, which provides incredibly detailed images of the whole sun 24 hours a day. Capturing an image more than once per second, SDO has provided an unprecedentedly clear picture of how massive explosions on the sun grow and erupt ever since its launch on Feb. 11, 2010. The imagery is also captivating, allowing one to watch the constant ballet of solar material through the sun's atmosphere, the corona. In honor of SDO's fifth anniversary, NASA has released a video showcasing highlights from the last five years of sun watching. Watch the movie to see giant clouds of solar material hurled out into space, the dance of giant loops hovering in the corona, and huge sunspots growing and shrinking on the sun's surface. The imagery is an example of the kind of data that SDO provides to scientists. By watching the sun in different wavelengths – and therefore different temperatures – scientists can watch how material courses through the corona, which holds clues to what causes eruptions on the sun, what heats the sun's atmosphere up to 1,000 times hotter than its surface, and why the sun's magnetic fields are constantly on the move.Five years into its mission, SDO continues to send back tantalizing imagery to incite scientists' curiosity. For example, in late 2014, SDO captured imagery of the largest sun spots seen since 1995 as well as a torrent of intense solar flares. Solar flares are bursts of light, energy and X-rays. They can occur by themselves or can be accompanied by what's called a coronal mass ejection, or CME, in which a giant cloud of solar material erupts off the sun, achieves escape velocity and heads off into space. In this case, the sun produced only flares and no CMEs, which, while not unheard of, is somewhat unusual for flares of that size. Scientists are looking at that data now to see if they can determine what circumstances might have led to flares eruptions alone. Goddard built, operates and manages the SDO spacecraft for NASA's Science Mission Directorate in Washington, D.C. SDO is the first mission of NASA's Living with a Star Program. The program's goal is to develop the scientific understanding necessary to address those aspects of the sun-Earth system that directly affect our lives and society. For More InformationSee [http://www.nasa.gov/content/goddard/videos-highlight-sdos-fifth-anniversary/](http://www.nasa.gov/content/goddard/videos-highlight-sdos-fifth-anniversary/) Related pages
Solarium - Resource Page
Feb. 4th, 2015
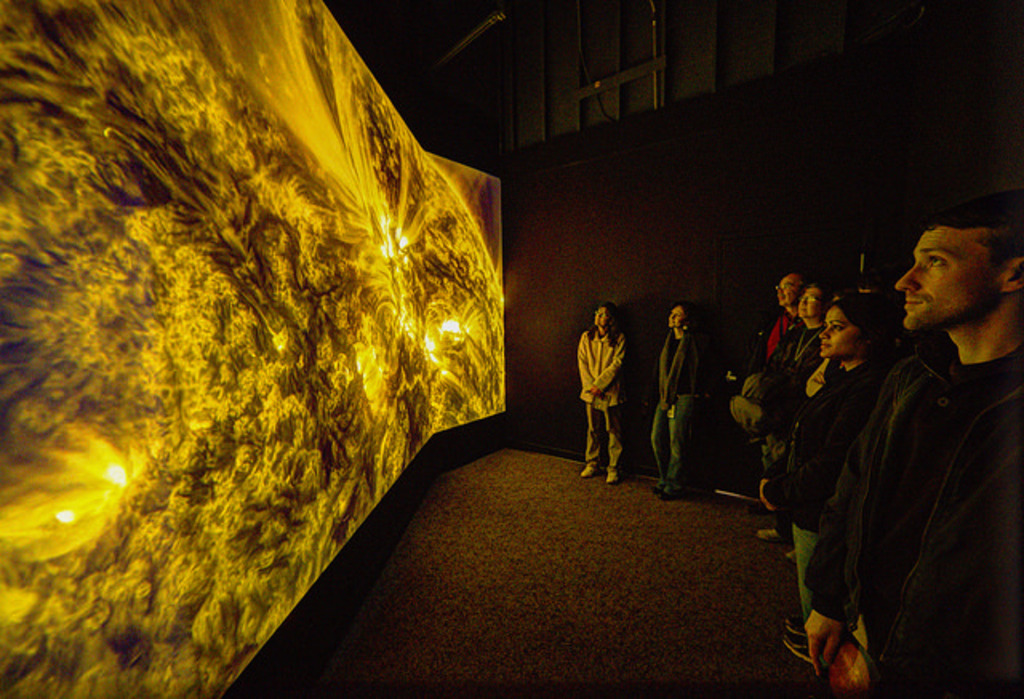
Read moreA child looks up at Solarium at the Goddard Visitor Center in Greenbelt, Maryland.Photo Credit: NASA's Goddard Space Flight Center A child looks up at Solarium at the Goddard Visitor Center in Greenbelt, Maryland.Photo Credit: NASA's Goddard Space Flight Center Standing in front of Solarium at the Goddard Visitor Center in Greenbelt, Maryland.Photo Credit: NASA's Goddard Space Flight Center Solarium at the Goddard Visitor Center in Greenbelt, Maryland.Photo Credit: NASA's Goddard Space Flight Center Still image of the entrance to Solarium at the Goddard Visitor Center in Greenbelt, Maryland.Photo Credit: NASA's Goddard Space Flight Center The silhouette of a child in Solarium at the Goddard Visitor Center in Greenbelt, Maryland.Photo Credit: NASA's Goddard Space Flight Center Solarium B-Roll ReelVideo Credit: NASA's Goddard Space Flight Center Concept art of Solarium at the Goddard Visitor Center in Greenbelt, Maryland. Cropped concept art of Solarium. Solarium at The Center for Creative Photography in Tucson, Arizona. Solarium was included in "Astronomical: Photographs of Our Solar System and Beyond," January 31, 2015 to May 17, 2015.Photo Credit: Joseph Rheaume and Allie Smith, Center for Creative Photography. A crowd looks at Solarium in February 2015 at the Goddard Visitor Center in Greenbelt, MD.Photo Credit: NASA's Goddard Space Flight Center A child in a 35 foot wide Solarium at Virginia Air and Space Center in Hampton, VA. A man poses in front of a single wall Solarium at the 2015 World Science Festival in New York, NY. Students in Solarium at the Filmatic Festival in May 2016 in San Diego, California. Photo Credit: Alex Matthews, Qualcomm Institute/UC San Diego A man watches Solarium at The American Museum of Natural History in March 2016 in New York, New York. Photo Credit: NASA's Goddard Space Flight Center/Genna Duberstein A man cheers at a Solarium installation in Nashville, TN, in August 2017. NASA's Goddard Space Flight Center/Genna Duberstein Three women watch a Solarium installation in Nashville, TN, in August 2017. People watch a Solarium installation in Nashville, TN, in August 2017. Solarium — a site specific, ultra-HD video installation — puts you directly in the heart of a mesmerizing show. The art taps into a vast reservoir of imagery from a NASA spacecraft, the Solar Dynamics Observatory (SDO).SDO watches the Sun in ultratraviolet light that is invisible to the naked eye. SDO takes a picture of the full disc of the Sun almost once a second. Each image has eight times as much resolution as an HD TV. The observatory records the solar images as a binary code, ones and zeros, which computer programs can translate into black-and-white pictures. Video producers can take these thousands of frames and treat them as footage, applying a cinematic tone conveyed through color correction, cropping, and applied camera movements.For b-roll of SDO footage, please see related media at the bottom of this page. For More InformationSee [http://www.nasa.gov/solarium](http://www.nasa.gov/solarium) Related pages
Untitled
April 9th, 2014
Read moreExplore views of active regions on the sun taken by NASA’s Solar Dynamics Observatory. Active regions appear as bright spots in this video, which shows solar material coursing through the sun’s atmosphere. Here, giant loops of solar material bridge a series of active regions. Arching structures called prominences sometimes hover over active regions, and can even explode off the sun. Beneath some active regions are dark spots (above, black), marking complex magnetic regions on the sun's surface. Related pages
SDO: Year 4
Feb. 11th, 2014
Read moreMassive solar flares, graceful eruptions of solar material, and an enormous sunspot make up some of the imagery captured by NASA's Solar Dynamics Observatory during its fourth year in orbit. Music: Stella Maris courtesy of Moby Gratis.Watch this video on the NASA Goddard YouTube channel.For complete transcript, click here. This image, and the one above, is a composite of 25 separate images spanning the period of February 11, 2013 to February 11, 2014. It uses the SDO AIA wavelength of 304 angstroms and reveals the zones on the sun where active regions, and associated eruptions, are most common during this part of the solar cycle. This version is widened to achieve a 16x9 aspect ratio.Credit: NASA's Goddard Space Flight Center/SDO/S. Wiessinger This image, and the one at the top, is a composite of 25 separate images spanning the period of February 11, 2013 to February 11, 2014. It uses the SDO AIA wavelength of 304 angstroms and reveals the zones on the sun where active regions, and associated eruptions, are most common during this part of the solar cycle. This version maintains the original aspect ratio of the AIA instrument imagery.Credit: NASA's Goddard Space Flight Center/SDO/S. Wiessinger The sun is always changing and NASA's Solar Dynamics Observatory is always watching. Launched on Feb. 11, 2010, SDO keeps a 24-hour eye on the entire disk of the sun, with a prime view of the graceful dance of solar material coursing through the sun's atmosphere, the corona. SDO's fourth year in orbit was no exception: NASA is releasing a movie of some of SDO's best sightings of the year, including massive solar explosions and giant sunspot shows. SDO captures images of the sun in 10 different wavelengths, each of which helps highlight a different temperature of solar material. Different temperatures can, in turn, show specific structures on the sun such as solar flares, which are giant explosions of light and x-rays, or coronal loops, which are streams of solar material traveling up and down looping magnetic field lines. The movie shows examples of both, as well as what's called prominence eruptions, when masses of solar material leap off the sun. The movie also shows a sunspot group on the solar surface. This sunspot, a magnetically strong and complex region appearing in mid-January 2014, was one of the largest in nine years. Scientists study these images to better understand the complex electromagnetic system causing the constant movement on the sun, which can ultimately have an effect closer to Earth, too: Flares and another type of solar explosion called coronal mass ejections can sometimes disrupt technology in space. Moreover, studying our closest star is one way of learning about other stars in the galaxy. NASA's Goddard Space Flight Center in Greenbelt, Md. built, operates, and manages the SDO spacecraft for NASA's Science Mission Directorate in Washington, D.C.SDO: Year One here.SDO: Year 2 here.SDO: Year 3 here.Information about the individual clips used in this video is here. For More InformationSee [http://www.nasa.gov/content/goddard/nasa-video-recaps-sdos-year-four/](http://www.nasa.gov/content/goddard/nasa-video-recaps-sdos-year-four/) Related pages
July 2012: Coronal Rain
Feb. 20th, 2013
Read moreAn HD1080 movie of the coronal rain (right limb of sun) in the 304 Å wavelength. An HD1080 movie of the opening part of the coronal rain (right limb of sun) in the 171 Å wavelength. A 4Kx4K frame set of the coronal rain (right limb of sun) in the 304 Å wavelength. A 4Kx4K frame set of the opening part of the coronal rain (right limb of sun) in the 171 Å wavelength. A moderate solar flare was emitted by the sun on July 19, 2012. At 5:58 UTC it peaked at M7.7 on the flare scale, which makes it fairly powerful, but still much weaker than X-class flares, which are the largest. What made this particular event so noteworthy was the associated activity in the sun's corona. For the next day, hot plasma in corona cooled and condensed along the strong magnetic fields of the region that produced the flare. Magnetic fields are invisible, but the plasma is very obvious in the extreme ultraviolet wavelength of 304 angstroms, which highlights material at a temperature of about 50,000 Kelvin. This plasma is attracted to the magnetic fields and outlines them very clearly as it slowly falls back to the solar surface. This process of condensing plasma falling to the surface is called coronal rain.The footage in this video was collected by the Solar Dynamics Observatory's AIA instrument. SDO collected one frame every 12 seconds so each second in this video corresponds to 6 minutes of real time. The video covers 4:30 UTC on July 19th to 2:00 UTC on July 20th, a period of 21 hours and 30 minutes.Music—"Thunderbolt" by Lars Leonhard Related pages
Monster Prominences with an Earth Eclipse (September 16, 2012)
Feb. 11th, 2013
Read moreAn HD movie of the prominences and eclipse. Full colorized 4Kx4K frames of SDO data. On September 16, 2012 the sun had a beautiful prominence (see Wikipedia) that slowly twisted and dissipated over several hours. It was captured in 304 angstrom light by the Solar Dynamics Observatory's AIA instrument at 4k resolution and 12s imaging cadence. The prominence was immediately followed by one of the many eclipses that SDO experiences during September, when its orbit places the Earth between it and the sun. Related pages
Sunspot Growth in June 2012
Feb. 11th, 2013
Read moreAn HD movie of the sunspot evolution. Full resolution, colorized 4Kx4K frames of the sunspot evolution. Groups of sunspots grow and die over a matter of days. This is a movie built from images taken by the SDO/HMI instrument over the course of 13 days during the rise of solar cycle 24. Related pages
Solar Prominence Dance - December 31, 2012
Feb. 11th, 2013
Read moreHD movie of the prominence. Colorized 4Kx4K SDO imagery of the prominences On the final day of 2012, the sun presented a beautiful twisting prominence that rose high into the corona for about 3 hours. It was most visible in extreme ultraviolet light with a wavelength of 304 angstroms. This wavelength highlights plasma with temperatures of around 50,000 Kelvin. The Atmospheric Imaging Assembly on NASA's Solar Dynamics Observatory captured the event at 4k resolution and a high imaging cadence of one image every 12 seconds. Related pages
SDO: September 13, 2012 Earth Eclipse
Feb. 11th, 2013
Read moreHD movie of the prominence & eclipse Colorized 4Kx4K SDO imagery of the prominence and eclipse. Twice a year, for three weeks near the equinox, NASA's Solar Dynamics Observatory (SDO) moves into its eclipse season — a time when Earth blocks its view of the sun for a period of time each day. Any spacecraft observing the sun from an orbit around Earth has to contend with such eclipses, but SDO's orbit is designed to minimize them as much as possible. On September 13, during the Fall 2012 eclipse season, SDO experienced on such eclipse followed by an unusually large, dark prominence that lifted up off the surface. The prominence was visible in extreme ultraviolet light with a wavelength of 304 angstroms. This wavelength highlights plasma with temperatures of around 50,000 Kelvin. The Atmospheric Imaging Assembly on NASA's Solar Dynamics Observatory captured the event at 4k resolution and a high imaging cadence of one image every 12 seconds. Related pages
A July 2012 CME from SDO
Jan. 31st, 2013
Read more1080 HD movie of the CME launch in the 171angstrom AIA filter. 4Kx4K frames with time tags and frame numbers in the 171angstrom AIA filter. 1080 HD movie of the CME launch. This movie has a slightly modified color table to bring out details of the flux rope on the right limb of the Sun in the 131angstrom AIA filter. 4Kx4K frames with time tags and frame numbers in the 131angstrom AIA filter. On July 18, 2012, a fairly small explosion of light burst off the lower right limb of the sun. Such flares often come with an associated eruption of solar material, known as a coronal mass ejection or CME — but this one did not. Something interesting did happen, however. Magnetic field lines in this area of the sun's atmosphere, the corona, began to twist and kink, generating the hottest solar material — a charged gas called plasma — to trace out the newly-formed slinky shape. The plasma glowed brightly in extreme ultraviolet images from the Atmospheric Imaging Assembly (AIA) aboard NASA's Solar Dynamics Observatory (SDO) and scientists were able to watch for the first time the very formation of something they had long theorized was at the heart of many eruptive events on the sun: a flux rope.Eight hours later, on July 19, the same region flared again. This time the flux rope's connection to the sun was severed, and the magnetic fields escaped into space, dragging billions of tons of solar material along for the ride — a classic CME. Related pages
The View from SDO: The August 31, 2012 Filament Eruption
Oct. 25th, 2012
Read moreSDO movie at 171Ångstroms of the filament eruption on August 31, 2012. High-Def version. SDO movie at 304Ångstroms of the filament eruption on August 31, 2012. Hi-Def version. SDO movie at 131Ångstroms of the filament eruption on August 31, 2012. High-Def version. SDO movie at 193Ångstroms of the filament eruption on August 31, 2012. High-Def version. SDO movie at 211Ångstroms of the filament eruption on August 31, 2012. High-Def version. SDO movie at 171Ångstroms of the filament eruption on August 31, 2012. 1Kx1K movie & 4Kx4K frames. SDO movie at 304Ångstroms of the filament eruption on August 31, 2012. 1Kx1K movie & 4Kx4K frames. SDO movie at 131Ångstroms of the filament eruption on August 31, 2012. 1Kx1K movie & 4Kx4K frames. SDO movie at 193Ångstroms of the filament eruption on August 31, 2012. 1Kx1K movie & 4Kx4K frames. SDO movie at 211Ångstroms of the filament eruption on August 31, 2012. 1Kx1K movie & 4Kx4K frames. The Solar Dynamics Observatory (SDO) observed a large filament eruption on August 31, 2012. This visualization was generated using high time resolution (12 seconds) data from the Atmospheric Imaging Assembly (AIA). Two datasets are used, the SDO/AIA 304 Ångstrom wavelength (orange color table) and the 171 Ångstrom wavelength (gold color table). These are wavelengths in the ultraviolet band of the electromagnetic spectrum. They are not visible to the human eye or to ground-based telescopes so coded colors are used in presentation.It is the source material for "August 31, 2012 Magnificent CME" visualization. Related pages
Active Region on the Sun Emits Another Flare
Oct. 23rd, 2012
Read moreVideo of a solar flare on Oct. 22, 2012 as captured by NASA's Solar Dynamics Observatory (SDO) in the 131 and 304 angstrom wavelengths. The 131 wavelength of light is used for observing solar material heated to 10 million degrees Kelvin, as in a solar flare. The wavelength is typically colorized in teal, as it is here. Credit: NASA/SDO/GSFC By observing the sun in a number of different wavelengths, NASA's telescopes can tease out different aspects of events on the sun. These four images of a solar flare on Oct. 22, 2012, show from the top left, and moving clockwise: light from the sun in the 171 angstrom wavelength, which shows the structure of loops of solar material in the sun's atmosphere, the corona; light in 335 angstroms, which highlights light from active regions in the corona; a magnetogram, which shows magnetically active regions on the sun; light in the 304 wavelength, which shows light from the region of the sun's atmosphere where flares originate. Credit: NASA/SDO/GSFC By observing the sun in a number of different wavelengths, NASA's telescopes can tease out different aspects of events on the sun. These four images of a solar flare on Oct. 22, 2012, show from the top left, and moving clockwise: light from the sun in the 171 angstrom wavelength, which shows the structure of loops of solar material in the sun's atmosphere, the corona; light in 335 angstroms, which highlights light from active regions in the corona; a magnetogram, which shows magnetically active regions on the sun; light in the 304 wavelength, which shows light from the region of the sun's atmosphere where flares originate. Credit: NASA/SDO/GSFC The October 22 X1.8 flare in a blended 304-Magnetogram image.Credit: NASA/SDO/GSFC The October 22 X1.8 flare in a blended 304-Magnetogram image. Cropped.Credit: NASA/SDO/GSFC A solar flare on Oct. 22, 2012 as captured by NASA's Solar Dynamics Observatory (SDO) in the 131 angstrom wavelength. This wavelength of light is used for observing solar material heated to 10 million degrees Kelvin, as in a solar flare. The wavelength is typically colorized in teal, as it is here. Credit: NASA/SDO The October 22 flare in 335 The October 22 flare in 304 The sun emitted a significant solar flare on Oct. 22, 2012, peaking at 11:17 p.m. EDT. The flare came from an active region on the left side of the sun that has been numbered AR 1598, which has already been the source of a number of weaker flares. This flare was classified as an X.1-class flare. "X-class" denotes the most intense flares, while the number provides more information about its strength. An X2 is twice as intense as an X1, an X3 is three times as intense, and on. An X-class flare of this intensity can cause degradation or blackouts of radio communications for about an hour. Solar flares are powerful bursts of radiation. Harmful radiation from a flare cannot pass through Earth's atmosphere to physically affect humans on the ground, however — when intense enough — they can disturb the atmosphere in the layer where GPS and communications signals travel. This can disrupt radio signals for anywhere from minutes to hours. The National Oceanic and Atmospheric Association, which is the United States government's official source for space weather forecasts and alerts, categorized the radio blackout associated with this flare as an R3, on a scale from R1 to R5. It has since subsided. Increased numbers of flares are quite common at the moment, since the sun's normal 11-year activity cycle is ramping up toward solar maximum, which is expected in 2013. Humans have tracked this solar cycle continuously since it was discovered in 1843, and it is normal for there to be many flares a day during the sun's peak activity. The first X-class flare of the current solar cycle occurred on Feb. 15, 2011 and there have been 15 X-class flares total in this cycle, including this one. The largest X-class flare in this cycle was an X6.9 on Aug. 9, 2011. This is the 7th X-class flare in 2012 with the largest being an X5.4 flare on March 7. This flare did not have an associated Earth-directed coronal mass ejection (CME), another solar phenomenon that can send solar particles into space and affect electronic systems in satellites and on Earth. Watch this video on YouTube. For More InformationSee [http://www.nasa.gov/mission_pages/sunearth/news/News102312-xflare.html](http://www.nasa.gov/mission_pages/sunearth/news/News102312-xflare.html) Related pages
August 31, 2012 Magnificent CME
Sept. 4th, 2012
Read moreThis movie shows the ejection from a variety of viewpoints as captured by NASA's Solar Dynamics Observatory (SDO), NASA's Solar Terrestrial Relations Observatory (STEREO), and the joint ESA/NASA Solar Heliospheric Observatory (SOHO). For complete transcript, click here. Image of the Earth to scale with the filament eruption. Note: the Earth is not this close to the sun, this image is for scale purposes only. The August 31 2012 coronal mass ejection shown in four different extreme ultraviolet wavelengths at 19:49 UT. Clockwise from upper left, the wavelengths are: 335, 171, 131, 304 angstroms. Short video of the CME in 304 and 171 and a cropped still of the CME in 304. An overlay blended version of the 304 and 171 angstrom wavelengths. An overlay blended version of the 304 and 171 angstrom wavelengths. Cropped. A lighten blended version of the 304 and 171 angstrom wavelengths. A lighten blended version of the 304 and 171 angstrom wavelengths. Cropped. Long frame sequences and 4k ProRes video of the filament eruption and CME in 304. The frame rate is one frame every 36 seconds. Long frame sequences and 4k ProRes video of the filament eruption and CME in 171. The frame rate is one frame every 36 seconds. A short frame sequence and still of the main part of the filament eruption and CME in 131. The frame rate is one frame every 36 seconds. A short frame sequence and still of the main part of the filament eruption and CME in 335. The frame rate is one frame every 36 seconds. A short frame sequence and still of the main part of the filament eruption and CME in 193. The frame rate is one frame every 36 seconds. On August 31, 2012 a long filament of solar material that had been hovering in the sun's atmosphere, the corona, erupted out into space at 4:36 p.m. EDT. The coronal mass ejection, or CME, traveled at over 900 miles per second. The CME did not travel directly toward Earth, but did connect with Earth's magnetic environment, or magnetosphere, with a glancing blow. causing aurora to appear on the night of Monday, September 3. For More InformationSee [http://www.nasa.gov/mission_pages/sunearth/news/News090412-filament.html](http://www.nasa.gov/mission_pages/sunearth/news/News090412-filament.html) Related pages
Active Region 1520 from SDO
July 16th, 2012
Read moreThis is 4Kx4K source frames and 1Kx1K movie of Active Region 1520. This is source material for the SDO view of Active Region 1520 in July of 2012. Related pages
Before the Flare: AR1520 and Shimmering Coronal Loops
July 16th, 2012
Read moreVideoFor complete transcript, click here. Still of AR1520 in 171 angstrom extreme ultraviolet light. 4096x4096 full-disk image and video of sun in 171 angstrom extreme ultraviolet light. The sun emitted a large flare on July 12, 2012, but earlier in the week it gave a demonstration of how gorgeous solar activity can be. This movie shows the sun from late July 8 to early July 10 shortly before it unleashed an X-class flare beginning at 12:11 PM EDT on July 12 as captured by the Solar Dynamics Observatory (SDO). Related pages
Venus Transit 2012 from Solar Dynamics Observatory
June 11th, 2012
Read moreFull disk and tracking view from AIA 171 Ångstroms. Full disk and tracking views from AIA 304 Ånstroms. Full disk and tracking views from Helioseismic and Magnetic Imager (HMI). Full disk and Tracking views of Venus Transit from Solar Dynamics Observatory (SDO). It includes images taken by the Helioseismic and Magnetic Imager (HMI) and the Atmospheric Imaging Assembly (AIA).These are the basic images, collected from the telemetry. To see the insets composited, see Venus Transit 2012 Composited Visuals. Related pages
Venus Transit 2012 Composited Visuals
June 11th, 2012
Read moreA high-cadence view of Venus Transit in AIA 171 angstroms. A high-cadence view of Venus Transit in HMI. A high-cadence view of Venus Transit in AIA at 304 angstroms These are composited Full Disk frames, constructed by compositing the HMI high-cadence inset with the low cadence full-resolution disk. These are composited Full Disk frames, constructed by compositing the AIA 171 high-cadence inset with the low cadence full-resolution disk. These visualizations were generated by compositing the small field-of-view, high-cadence closeups of Venus with the full-disk, low-cadence imagery from Solar Dynamics Observatory (SDO). Two different instruments are used: the Helioseismic and Magnetic Imager (HMI) which sees light in the visible range, and the Atmospheric Imaging Assembly (AIA) which sees light in several wavelengths in the ultraviolet range. To find out more information about these instruments, check out The Atmospheric Imaging Assembly Tutorial.Some artifacts may be visible from the compositing, but you have to look pretty closely to see them.The color table threshold was raised for these images, reducing the amount of noise visible in the images. Note: There is an interesting artifact worthy of mention and clarification, and that is as Venus crosses the solar limb, the limb appears to be visible through the planet in some of the imagers (most notably the ultraviolet channels). Discussion with the scientists who built the imagers suggest this might be 'crosstalk' between the readouts of the four CCD panels that make up a complete image. It is an artifact of the imaging system. Related pages
SDO's Ultra-high Definition View of 2012 Venus Transit
June 4th, 2012
Read moreCollection of SDO footage of transit in multiple wavelengths set to music. The music track is "Dramatic Intro" from Stockmusic.netFor complete transcript, click here. Sequence of images of 171 transit composited together to show path of Venus. This now has an improved version with better color and detail and a full 4kx4k or cropped 4kx2k size suitable for print. 193 angstrom image from SDO 171 angstrom HMI Continuum. Portion of visible spectrum. Full size versions and half-size versions. Cropped HMI Continuum 304 angstrom full disk. In 4k and 2k. Cropped 304. 171 Mid-transit cropped 171 full disk Mid-transit in 4k and 2k 304 Mid-transit cropped 304 full disk mid-transit 4k and 2k 171 Egress begins. Cropped. 171 Egress begins. Full disk 4k and 2k. 304 Egress begins. Cropped. 304 Egress begins. Full disk 4k and 2k. HMI Continuum. Almost gone... 193 Showing Venus completely off the limb and backlit by only the corona. Launched on Feb. 11, 2010, the Solar Dynamics Observatory, or SDO, is the most advanced spacecraft ever designed to study the sun. During its five-year mission, it will examine the sun's atmosphere, magnetic field and also provide a better understanding of the role the sun plays in Earth's atmospheric chemistry and climate. SDO provides images with resolution 8 times better than high-definition television and returns more than a terabyte of data each day.On June 5 2012, SDO collected images of the rarest predictable solar event—the transit of Venus across the face of the sun. This event lasted approximately 6 hours and happens in pairs eight years apart, which are separated from each other by 105 or 121 years. The last transit was in 2004 and the next will not happen until 2117.The videos and images displayed here are constructed from several wavelengths of extreme ultraviolet light and a portion of the visible spectrum. The red colored sun is the 304 angstrom ultraviolet, the golden colored sun is 171 angstrom, the magenta sun is 1700 angstrom, and the orange sun is filtered visible light. 304 and 171 show the atmosphere of the sun, which does not appear in the visible part of the spectrum. Related pages
Wispy 'Plasma Dancer' on the limb of the Sun
May 16th, 2012
Read moreHalf resolution (2Kx2K) movies from SDO. Frame sets for 5x3 Hyperwall This movie actually exhibits a number of interesting solar phenomena.The primary feature of interest was the whirrling tower of plasma on the lower right limb. Related pages
HD Close up of March 6th X5.4 Flare
March 7th, 2012
Read moreMassive Flare Gets HD Closeup.Credit: NASA/GSFC/SDOFor complete transcript, click here. This movie of the March 6, 2012 X5.4 flare was captured by the Solar Dynamics Observatory (SDO) in the 171 angstrom wavelength. One of the most dramatic features is the way the entire surface of the sun seems to ripple with the force of the eruption. This movement comes from something called EIT waves — because they were first discovered with the Extreme ultraviolet Imaging Telescope (EIT) on the Solar Heliospheric Observatory. Since SDO captures images every 12 seconds, it has been able to map the full evolution of these waves and confirm that they can travel across the full breadth of the sun. The waves move at over a million miles per hour, zipping from one side of the sun to the other in about an hour. The movie shows two distinct waves. The first seems to spread in all directions; the second is narrower, moving toward the southeast. Such waves are associated with, and perhaps trigger, fast coronal mass ejections, so it is likely that each one is connected to one of the two CMEs that erupted on March 6. Credit: NASA/SDO Version of Massive Flare Gets HD Close Up without labels. Footage and music onlyFor complete transcript, click here. SOHO LASCO view of flare and CME 171 angstrom ultraviolet light still of flare. 171 angstrom ultraviolet light still of flare, cropped. 131 angstrom ultraviolet light still of flare. 131 angstrom ultraviolet light still of flare, cropped. 171 angstrom ultraviolet light still of flare. 171 angstrom ultraviolet light still of flare, cropped. An aurora on March 8, 2012 shimmering over snow-covered mountains in Faskrudsfjordur, Iceland.Credit: Jónína Óskarsdóttir The sun erupted with one of the largest solar flares of this solar cycle on March 6, 2012 at 7PM ET. ?This flare was categorized as an X5.4, making it the second largest flare — after an X6.9 on August 9, 2011 — since the sun's activity segued into a period of relatively low activity called solar minimum in early 2007. The current increase in the number of X-class flares is part of the sun's normal 11-year solar cycle, during which activity on the sun ramps up to solar maximum, which is expected to peak in late 2013. About an hour later, at 8:14 PM ET, March 6, the same region let loose an X1.3 class flare. ?An X1 is 5 times smaller than an X5 flare. These X-class flares erupted from an active region named AR 1429 that rotated into view on March 2. ?Prior to this, the region had already produced numerous M-class and one X-class flare. ?The region continues to rotate across the front of the sun, so the March 6 flare was more Earthward facing than the previous ones. ?It triggered a temporary radio blackout on the sunlit side of Earth that interfered with radio navigation and short wave radio.In association with these flares, the sun also expelled two significant coronal mass ejections (CMEs), which are traveling faster than 600 miles a second and may arrive at Earth in the next few days. ?In the meantime, the CME associated with the X-class flare from March 4 has dumped solar particles and magnetic fields into Earth's atmosphere and distorted Earth's magnetic fields, causing a moderate geomagnetic storm, rated a G2 on a scale from G1 to G5. ?Such storms happen when the magnetic fields around Earth rapidly change strength and shape. ?A moderate storm usually causes aurora and may interfere with high frequency radio transmission near the poles. ?This storm is already dwindling, but the Earth may experience another enhancement if the most recent CMEs are directed toward and impact Earth. In addition, last night's flares have sent solar particles into Earth's atmosphere, producing a moderate solar energetic particle event, also called a solar radiation storm. These particles have been detected by NASA's SOHO and STEREO spacecraft, and NOAA's GOES spacecraft. ?At the time of writing, this storm is rated an S3 on a scale that goes up to S5. ?Such storms can interfere with high frequency radio communication. Besides the August 2011 X-class flare, the last time the sun sent out flares of this magnitude was in 2006. ?There was an X6.5 on December 6, 2006 and an X9.0 on December 5, 2006. Like the most recent events, those two flares erupted from the same region on the sun, which is a common occurrence. Related pages
The Rising Solar Cycle: X5.4 Flare ('W' sunspot group) seen by SDO
March 7th, 2012
Read moreThe solar flare in the 171A (17.1nm) filter The solar flare in the 131angstrom (13.1nm) filter. Sunspot group 1429 of solar cycle 24 has launched an X5.4 flare can coronal mass ejection (CME) that is forecast to impact the EarthThis visualization has the full 4Kx4K frames from the 17.1 nm and 13.1 nm filters on the Solar Dynamics Observatory. 2Kx2K MPEG-4 movies are also available. Related pages
SDO Launch Footage
Feb. 14th, 2011
Read moreFootage of launch of the Solar Dynamics Observatory from February 11, 2010 from Cape Canaveral Air Force Station. SDO launch sequence video Related pages
Why Does NASA Observe The Sun in Different Colors?
June 18th, 2021
Read moreMusic credits: “Swirling Blizzard” and “Endless Swirl” by Laurent Dury [SACEM] from Universal Production Music Watch this video on the NASA Goddard YouTube channel.Complete transcript available. The Solar Dynamics Observatory, or SDO, spacecraft was launched on Feb. 11, 2010, and began collecting science data a few months later. With two imaging instruments – the Atmospheric Imaging Assembly and the Helioseismic and Magnetic Imager, which were designed in concert to provide complementary views of the Sun – SDO sees the Sun in more than 10 distinct wavelengths of light, showing solar material at different temperatures. SDO also measures the Sun’s magnetic field and the motion of solar material at its surface, and, using a technique called helioseismology, allows scientists to probe deep into the Sun's interior, where the Sun’s complex magnetic fields sprout from. And with more than a decade of observation under its belt, SDO has provided scientists with hundreds of millions of images of our star. For More InformationSee [Sun Science Stamps Highlight a Decade of Sun-Watching from Space](https://www.nasa.gov/feature/goddard/2021/sun-science-stamps-highlight-a-decade-of-sun-watching-from-space/) Related pages