America On Fire
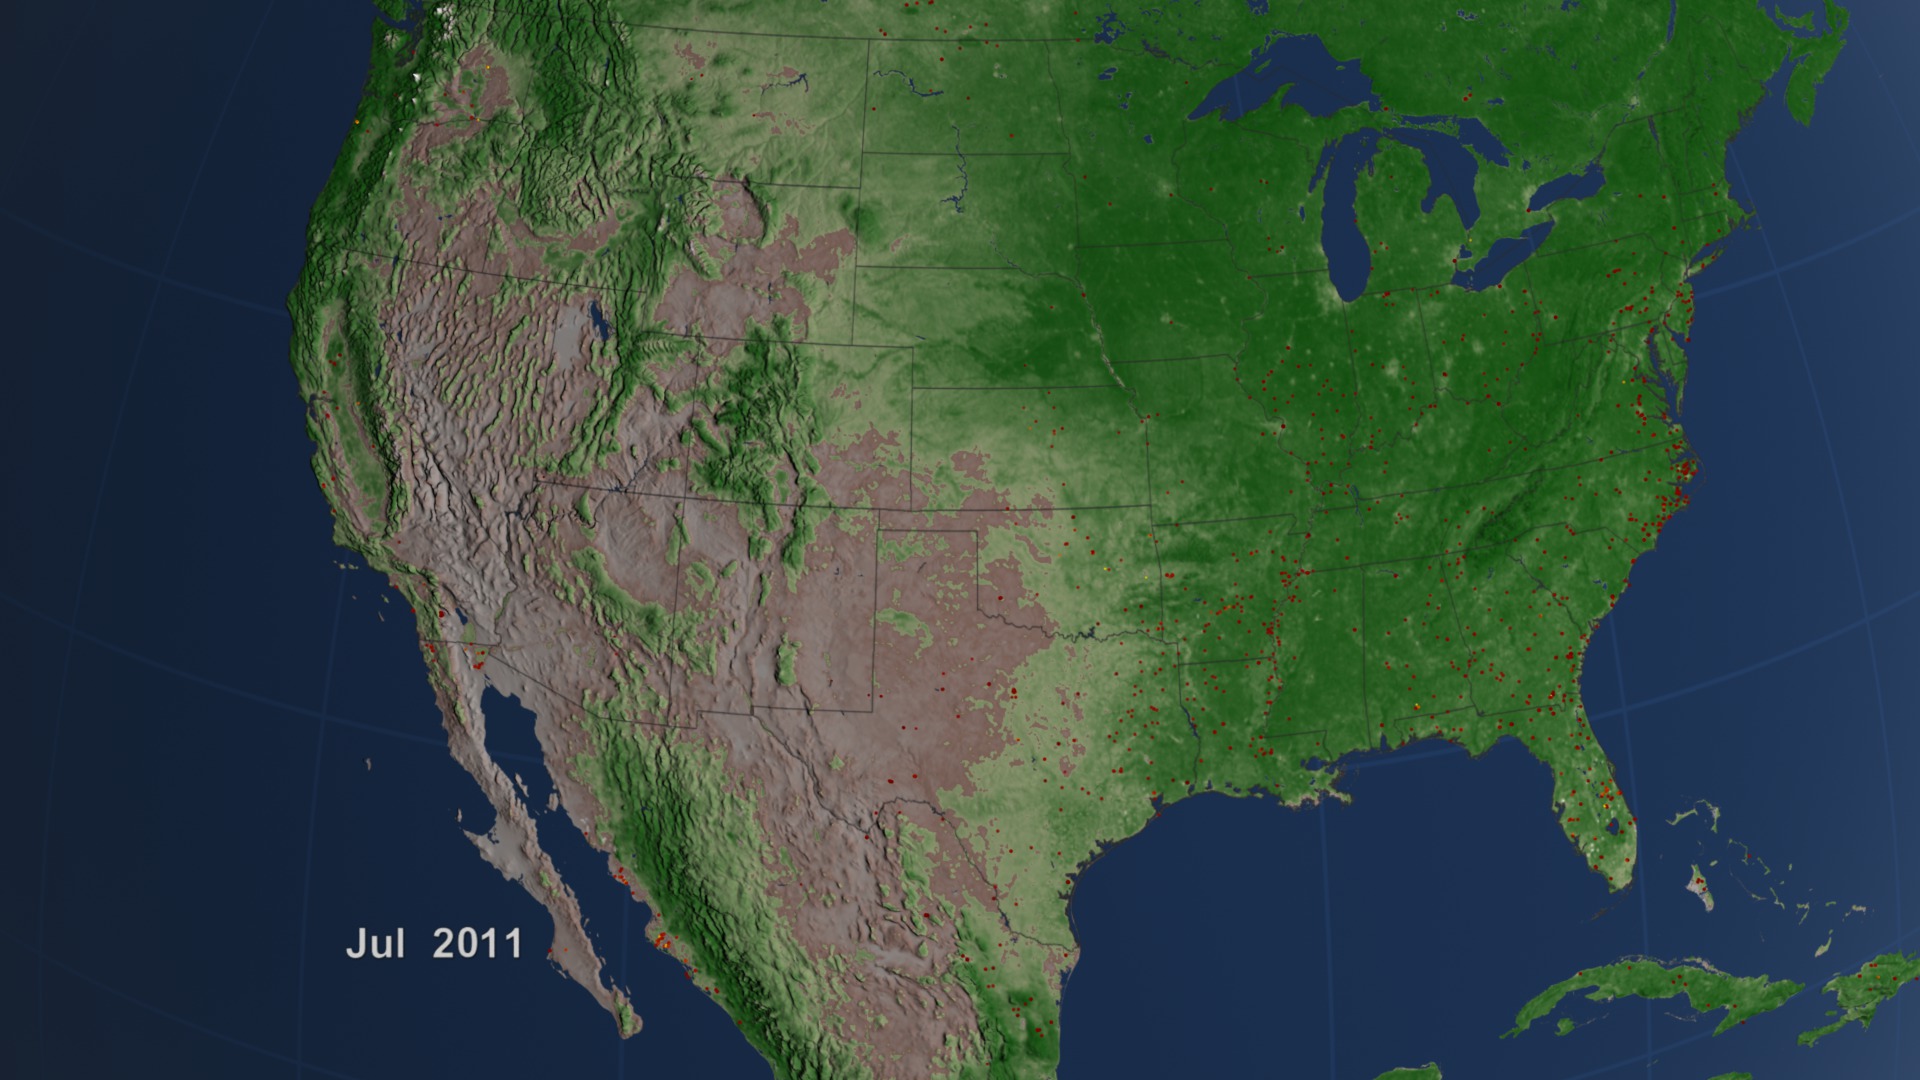
For more than a decade, NASA satellites have monitored fires around the world. The data that is collected provides scientists with information about the location of fires, how much land is burned and how fires are responding to changes in climate. Dry conditions, for example, fueled a number of wildfires in the United States in recent years. From 2009 to 2011, more than 200,000 fires burned 18 million acres, or roughly all of Massachusetts, Vermont, New Hampshire, Delaware and Rhode Island. Exacerbated by ongoing drought conditions in the South, the state of Texas experienced an extreme wildfire season in 2011 that consumed more than 2.7 million acres. The visualization shows fires detected in the United States from July 2002 through July 2011 by the MODIS instrument aboard NASA's Aqua and Terra satellites. Look for fires that reliably burn each year in western states and across the Southeast.

Watch fires ignite across the nation.
Red dots mark the location of fires observed in the United States.
Satellites routinely detect a mixture of prescribed and agricultural burning across the Southeast.
Border crossing: In 2002 strong winds fanned fires in Oregon that spread across the state line and into California.
Smoke rises from wildfires northwest of Houston, Texas, in Apr. 2011.
Wildfires ignited throughout the western United States in Aug. 2012. Drought conditions fueled a number of the fires.
Compare the brightness of fires (marked with yellow arrows) to U.S. metropolitan areas seen in this satellite image taken at night.
For More Information
See NASA.gov
Credits
Please give credit for this item to:
NASA's Goddard Space Flight Center
Oregon image courtesy of Jacques Descloitres, MODIS Land Rapid Response Team
Texas image courtesy of Jeff Schmaltz, MODIS Rapid Response Team
Western wildires image courtesy of Jeff Schmaltz, LANCE MODIS Rapid Response
Night image courtesy of NASA Earth Observatory
-
Animators
- Lori Perkins (NASA/GSFC)
-
Greg Shirah
(NASA/GSFC)

-
Producer
- Kayvon Sharghi (USRA)
-
Scientists
- Chris Justice (University of Maryland)
- Louis Giglio (University of Maryland)
- Luigi Boschetti (University of Maryland College Park)
-
Writer
- Kathryn Hansen (Wyle Information Systems)
Related
- ID: 3873
 Visualization
Release date
This page was originally published on Thursday, September 6, 2012.
This page was last updated on Wednesday, May 3, 2023 at 1:52 PM EDT.