RBSP L-14 Press Conference
The Radiation Belt Storm Probes mission is part of NASA's Living With a Star Geospace program to explore fundamental processes that operate throughout the solar system, in particular those that generate hazardous space weather effects near the Earth and phenomena that could affect solar system exploration.
RBSP is designed to help us understand the sun's influence on the Earth and near-Earth space by studying the planet's radiation belts on various scales of space and time.
Understanding the radiation belt environment and its variability has extremely important practical applications in the areas of spacecraft operations, spacecraft and spacecraft system design, mission planning, and astronaut safety.
RBSP is scheduled to launch no earlier than 4:08 a.m. Thursday, Aug. 23 from Cape Canaveral Air Force Station in Florida. The twin probes will lift off on a United Launch Alliance Atlas V rocket.
News conference panelists are:
— Madhulika Guhathakurta, Living With a Star program scientist, NASA Headquarters, Washington
— Mona Kessel, RBSP program scientist, NASA Headquarters
— Barry Mauk, RBSP project scientist, Johns Hopkins University Applied Physics Laboratory (APL), Laurel, Md.
— Rick Fitzgerald, RBSP project manager, APL, Laurel, Md.

Living with a Star Overview
This image provides the rationale for LWS Program "Science with relevance to life and society". The upper half shows the sun's influence on Earth's magnetosphere, ionosphere, mesosphere, interaction with the atmosphere of other planets and understanding basic physical processes of magnetized plasma. The lower half shows the increasing vulnerability of human society to solar flares and coronal mass ejections.
Credit: NASA
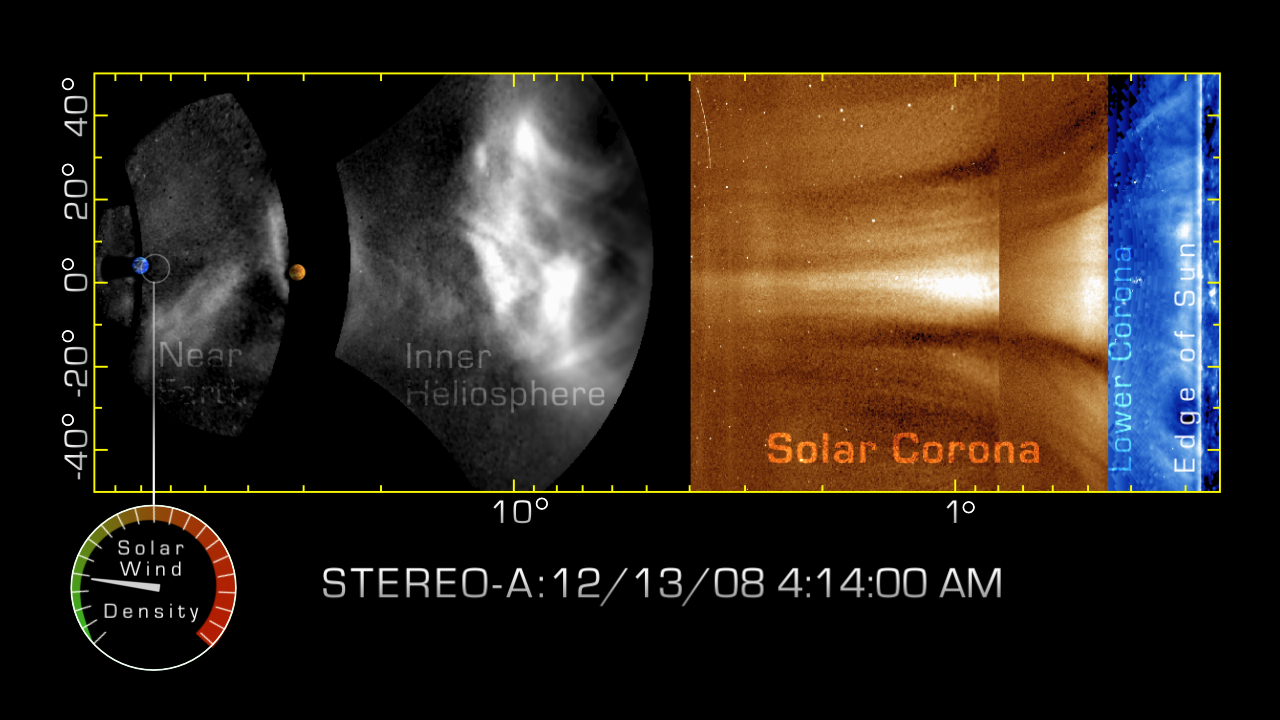
To track CMEs from the sun to Earth, STEREO uses five digital cameras, from a telescope pointed straight at the sun to a wide-field camera that sees Earth and Venus more than 45 degrees away. By distorting the many fields-of-view into radial coordinates, STEREO scientists can easily watch the CME's transit in a single video.
Credit: NASA/SwRI/STEREO
The video can be found here.
Reprocessed images from NASA's STEREO-A spacecraft allow scientists to trace the anatomy of the December 2008 CME as it moves and changes on its journey from the Sun to the Earth, identify the origin and structure of the material that impacted Earth, and connect the image data directly with measurements at Earth at the time of impact.
Credit: NASA/Goddard Space Flight Center/SwRI/STEREO
The video can be found here.
Earth's Magnetosphere
The simulation shows the magnetosphere and its response to the onset of the January 10, 1997 magnetic storm, solar wind arriving from the left. The translucent surface represents the shape and extent of Earth's magnetic field. The colormap indicates plasma density and shows the sunward shock wave around the Earth.
Credit: C. Goodrich
Top - Comparison of 81-day smoothed sunspot numbers (red), with magnetic activity as represented by the AA-index (yearly averaged (blue) and monthly mean (grey)). The average predictions for sunspot number in solar cycle 24 by the NOAA Solar Cycle Prediction Panel are indicated by dashed lines.
Bottom - Percentage of days per year with solar wind structures of co-rotating high speed streams from coronal holes (blue), transient structures that include CMEs and other transient flows (red), and slow speed flows (green).
Credit: Defined as in Emery et al., 2009, JASTP. Doi: 10.1016/j.jastp.2008.08.005
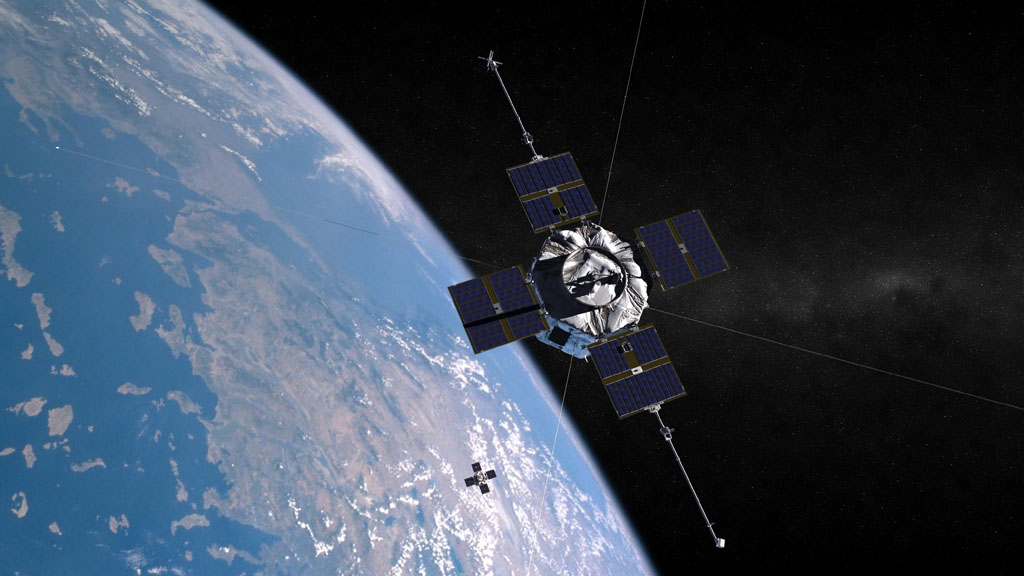
Model of the Earth's Van Allen radiation belts with the 2 satellites from NASA's Radiation Belt Storm Probes pictured.
Credit: NASA
Left to right pictured: Carl McIIwain, James Van Allen, George Ludwig, Ernie Ray.
Credit: University of Iowa
Left to right pictured Pickering, James Van Allen, Werner Von Braun holding up a model of Explorer 1 after its successful launch in 1958.
Credit: NASA
left: Van Allen's sketch of the inner and outer zones of the radiation belt made after Pioneer 1 and 3 data returns, as the sketch was presented in a paper by J. A. Van Allen and L. A. Frank, in the science journal Nature in 1959. The two lines that go from the upper left to the lower right are the paths of the satellite. The plot is of the radiation dosages received by the two satellites as they pass into and out of the radiation belt zones. Through multiple rocket launches and satellite studies, the general scope and strength of the belts was eventually determined.
Credit: NASA/Goddard Space Flight Center, Time
Movie of the changing radiation belts as measured by SAMPEX/LICA from January 1, 1998 to March 1, 2005.
Credit: NASA/Goddard Space Flight Center, J. Mazur-The Aerospace Corporation
Everyone is familiar with changes in the weather on Earth, but "weather" also occurs in space. Changes in the sun
KASI (Korea Astronomy and Space Science Institute) ground receiver built for receiving data from NASA's RBSP mission Space weather broadcast.
Credit: Korea Astronomy and Space Science Institute (KASI)
Animation showing the dynamic and active radiation belts during two solar storms, made from data obtained by the Solar, Anomalous, and Magnetospheric Particle Explorer (SAMPEX).
Credit: NASA/Johns Hopkins University Applied Physics Laboratory
Radiation regions like the belts are found throughout our solar system and the universe. Here are four objects with radiation regions: The sun, Earth, Jupiter, and the Crab Nebula.
Credit: NASA/Johns Hopkins University Applied Physics Laboratory
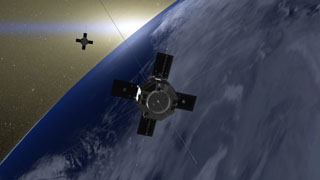
Still of the RBSP spacecraft orbiting Earth and showing their path through the two radiation belts, which are made visible in false color.
Credit: NASA/Johns Hopkins University Applied Physics Laboratory
The RBSP spacecraft: Instruments investigating particles are highlighted first; then instruments investigating fields and waves are highlighted. Unlabeled.
Credit: NASA/Johns Hopkins University Applied Physics Laboratory
The RBSP spacecraft: Instruments investigating particles are highlighted first; then instruments investigating fields and waves are highlighted.
Credit: NASA/Johns Hopkins University Applied Physics Laboratory
The RBSP spacecraft: Instruments investigating particles are highlighted first; then instruments investigating fields and waves are highlighted.
Credit: NASA/Johns Hopkins University Applied Physics Laboratory
Animation showing RBSP's deployment of its solar arrays and the Electric and Magnetic Field Instrument Suite and Integrated Science (EMFISIS) magnetometer booms.
Credit: NASA/Johns Hopkins University Applied Physics Laboratory
A nearly 9mm-thick aluminum box known as the "doghouse" is placed over critical RBSP components to protect them from penetrating charged particles.
Credit: NASA/Johns Hopkins University Applied Physics Laboratory
Animation of RBSP spacecraft A separating from spacecraft B, and then spacecraft B separating from the Centaur stage.
Credit: NASA/Johns Hopkins University Applied Physics Laboratory
Animation of the Electric Field and Waves Suite (EFW) spin axis boom antenna deployment.
Credit: NASA/Johns Hopkins University Applied Physics Laboratory
This compilation of integration and testing footage shows: solar array deployment testing; electric and Magnetic Field Instrument Suite and Integrated Science (EMFISIS) magnetometer boom deployment testing; stacked spacecraft vibration testing; magnetic swing testing; launch vehicle separation testing; Electric Field and Waves Suite (EFW) instrument antenna testing; thermal and vacuum testing; spin testing (55 RPM).
Credit: NASA/Johns Hopkins University Applied Physics Laboratory
For complete transcript, click here.
CAD rendering of the RBSP spacecraft and enclosing rocket.
Credit: NASA/Johns Hopkins University Applied Physics Laboratory
The stacked RBSP spacecraft just prior to encapsulation at Astrotech Space Operations in Florida, along with the RBSP team.
Credit: NASA/ULA/KSC
For More Information
Credits
Please give credit for this item to:
NASA/Goddard Space Flight Center. However, individual images and video should be credited as indicated above
-
Producers
- Scott Wiessinger (USRA)
- Genna Duberstein (USRA)
Missions
This page is related to the following missions:Series
This page can be found in the following series:Tapes
The media on this page originally appeared on the following tapes:-
RBSP L-14 Press Conference
(ID: 2012088)
Thursday, August 9, 2012 at 4:00AM
Produced by - Robert Crippen (NASA)
Related
- ID: 11212

- ID: 11073
 Produced Video
 - ID: 11069
 Produced Video
 - ID: 10809
 Produced Video
Release date
This page was originally published on Thursday, August 9, 2012.
This page was last updated on Wednesday, May 3, 2023 at 1:52 PM EDT.