Greenland's Vanishing Ice
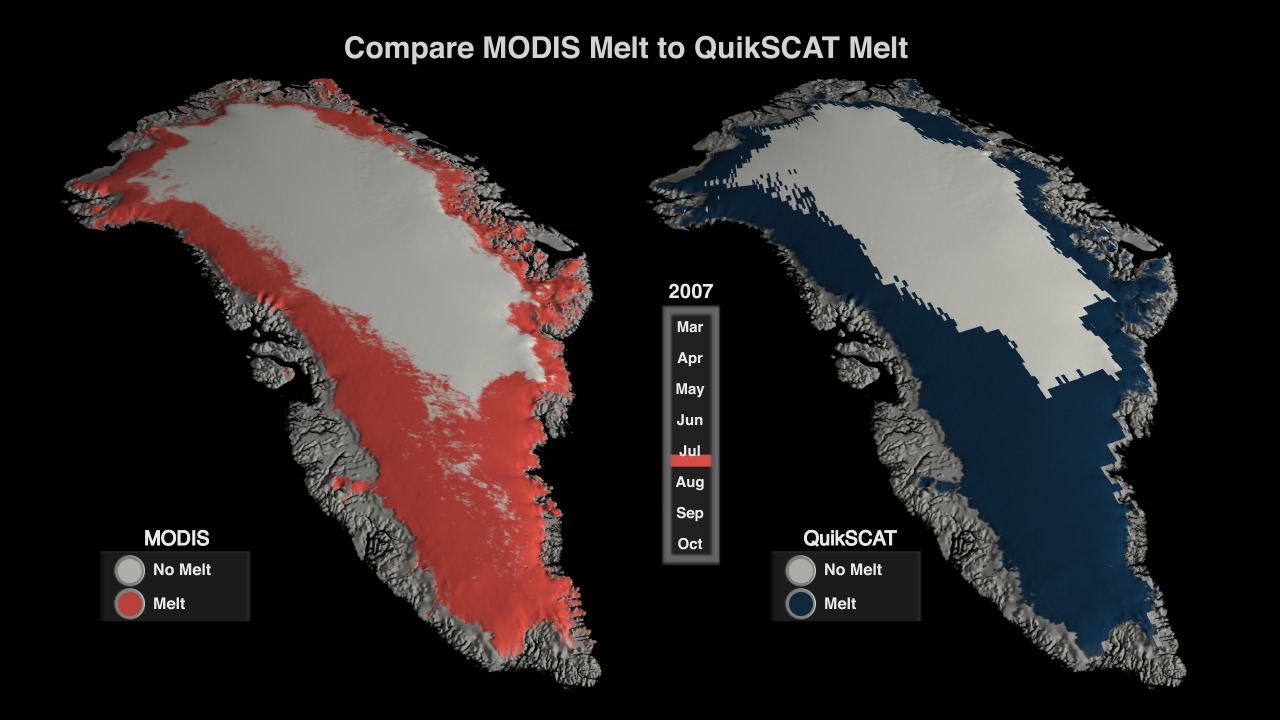
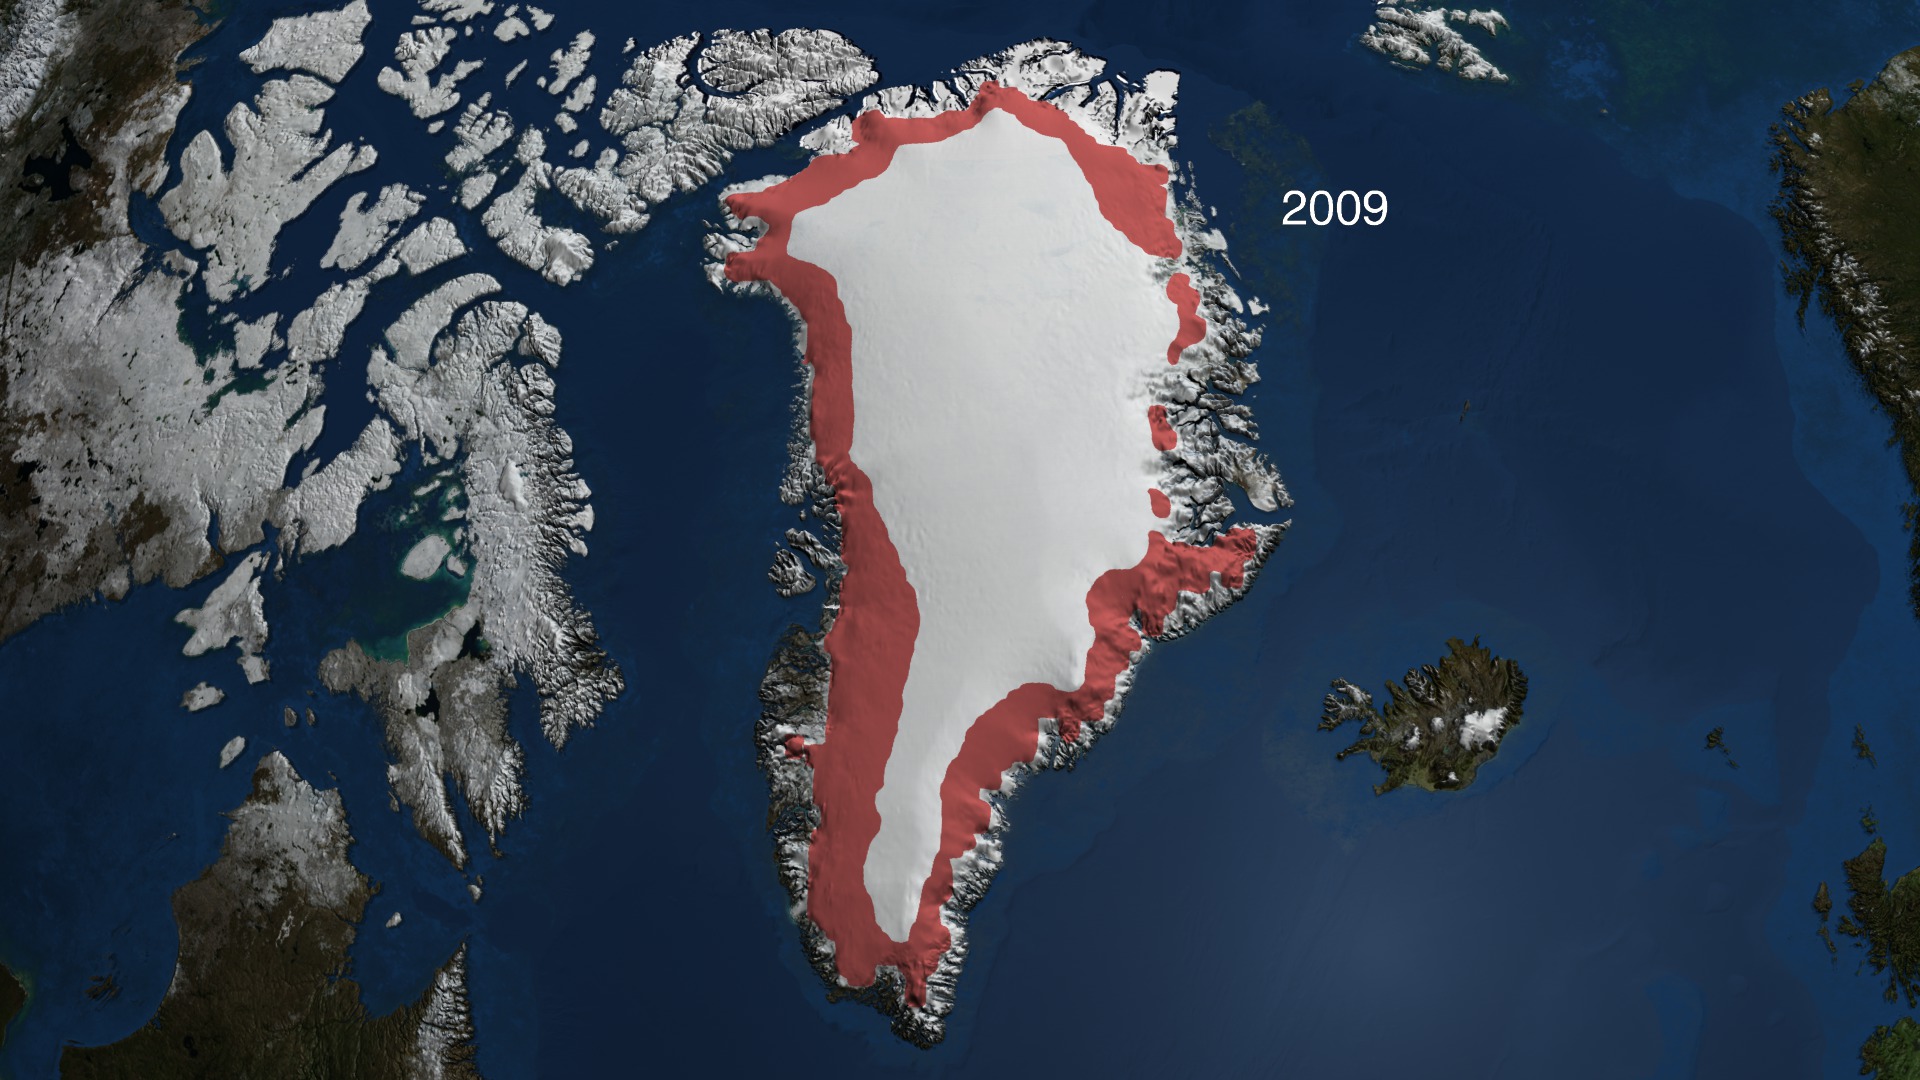
The fringe of the Greenland ice sheet endures an annual freeze-and-thaw cycle. Plunging temperatures and ample snow in fall and winter replenish the massive ice sheet, which covers 80 percent of the country's landmass. Endless sun in spring and summer melt ice at the surface and the meltwater runs off through the country's rocky edges to the oceans. This kind of natural cycle allows scientists to observe the impact of climate change over time. Satellites have provided continual monitoring of Greenland's ice cover since 1979. While annual melt patterns vary greatly, three decades of data reveal trends of increasing surface melt and number of melt days, as seen in the first visualization below. The annual Greenland melt also opens a window on one of the most important aspects of science by satellite: With more than one satellite instrument measuring the melt, scientists can compare data to provide a measure of confidence in their observations. In the second visualization, watch how two different satellite datasets created almost mirror-image views of Greenland's ice melt extent in one year.

Scientists can see and fact-check from space how ice melts in Greenland each year.
Satellite measurements of Greenland's ice cover from 1979 to 2009 reveals a trend of increased melting.
NASA's MODIS and QuikSCAT satellite data from 2007 were compared to confirm the precision of different melt observations.
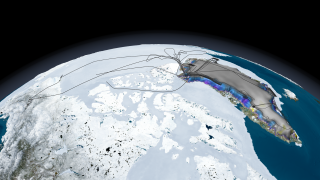
NASA studies Greenland by plane, too: Black lines trace research flight paths from Operation IceBridge's Arctic 2010 campaign.
Credits
Please give credit for this item to:
NASA's Goddard Space Flight Center
-
Animators
-
Cindy Starr
(Global Science and Technology, Inc.)

- Lori Perkins (NASA/GSFC)
-
Cindy Starr
(Global Science and Technology, Inc.)
-
Producer
- Jefferson Beck (USRA)
-
Scientists
- Dorothy Hall (NASA/GSFC)
- Son Nghiem (NASA/JPL CalTech)
- Waleed Abdalati (NASA/GSFC)
- Thorsten Markus (NASA/GSFC)
- Jay Zwally (NASA/GSFC)
- Lora Koenig (NASA/GSFC)
-
Project support
- John Sonntag (EGG)
-
Writer
- Patrick Lynch (Wyle Information Systems)
Related
- ID: 3823
- ID: 3738
 Visualization
 - ID: 3721
 Visualization
Release date
This page was originally published on Thursday, December 15, 2011.
This page was last updated on Wednesday, May 3, 2023 at 1:53 PM EDT.