Arctic Sea Ice 2011 Minimum
Sea ice in the Arctic ocean declines from its near-maximum state in early spring 2011 through the summer and up until the summer minimum of Sept. 9, 2011, in this visualization of data collected by the AMSR-E instrument on NASA's Aqua satellite. Sea ice goes through this shrink-and-swell rhythm every year, but since consistent satellite observations began in 1979, both the annual minimum at the end of summer and the annual maximum at the end of winter continue to decline in area and thickness.
Arctic sea ice extent on Sept. 9 was 4.33 million square kilometers (1.67 million square miles), placing 2011 as the second lowest minimum ice extent on record. Ice extent was 2.43 million square kilometers (938,000 square miles) below the 1979 to 2000 average.
Below two versions of the AMSR-E visualization is a video featuring NASA Cryosphere Program Manager Tom Wagner, who shares his insights on the 2011 minimum.
Arctic sea ice from March 7 to September 9, 2011.
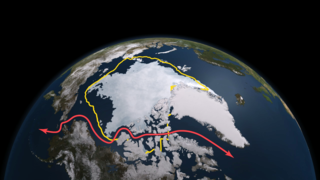
Arctic sea ice from March 7 to September 9, 2011, ending with a comparison of the 30-year average minimum extent (in yellow) and the Northwest Passage (shown in red.)
In a taped version of a live broadcast, NASA Cryosphere Program Manager Tom Wagner shares his insights on the 2011 minimum.
For complete transcript, click here.

Dates with alpha channel
Credits
Please give credit for this item to:
NASA/Goddard Space Flight Center
-
Animators
- Trent L. Schindler (UMBC)
-
Cindy Starr
(Global Science and Technology, Inc.)

-
Producers
- Jefferson Beck (USRA)
- Malissa Reyes (USRA)
-
Writer
- Patrick Lynch (Wyle Information Systems)
Series
This page can be found in the following series:Datasets used
-
[Aqua: AMSR-E]
ID: 4For more information, please click http://wwwghcc.msfc.nasa.gov/AMSR/
See all pages that use this dataset
Note: While we identify the data sets used on this page, we do not store any further details, nor the data sets themselves on our site.
Related
- ID: 10825
 Produced Video
Release date
This page was originally published on Thursday, September 15, 2011.
This page was last updated on Wednesday, May 3, 2023 at 1:53 PM EDT.