The Big Melt
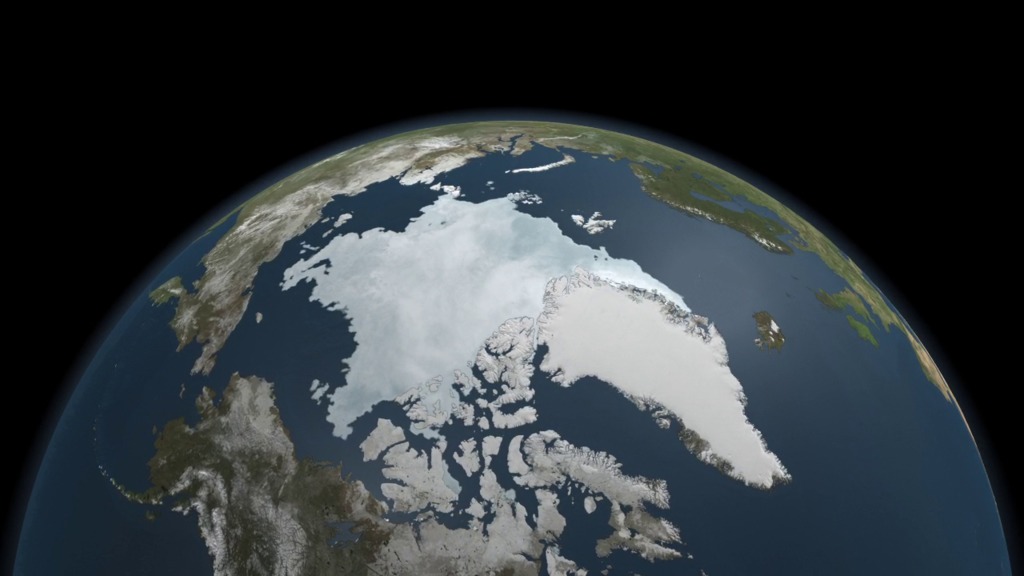
Each year, as temperatures dip in the wintertime, new sea ice emerges from cold Arctic waters. By late summer, sea ice extent shrinks as warm ocean temperatures eat away at the ice. This shrink-and-swell rhythm is one of constant change. But in the 30 years since scientists began monitoring Arctic sea ice with satellites, a persistent trend has emerged: Less ice grows back in winter, more ice melts in summer. Year-to-year ups and downs still occur, but the long-term trend comes through clear in the satellite data, and correlates strongly with rising surface temperatures. The end result of this change remains unknown, as Arctic sea ice cover plays a dynamic role in regulating ocean currents, polar ecosystems and even the heat budget of the Earth. The extent of the oldest, thickest ice is now declining at more than 15 percent per decade. Arctic sea ice reached its second smallest extent on record in 2011, opening up the fabled Northwest Passage (shown with a red line). Watch in the visualization below how the Arctic sea ice cap changes throughout a season and now covers far less area than the 30-year average (shown in yellow).

At the top of the world, a pulsing, shifting body of floating ice is having profound effects on the planet's weather and climate.
This year's annual Arctic sea ice melt put it far below the 30-year average and opened Northwest Passage shipping lanes.
NASA scientist Tom Wagner shares his analysis of the 2011 sea ice minimum.
A recent NASA-funded expedition on the U.S. Coast Guard Cutter Healy studied sea ice and changing ocean conditions for five weeks in the Arctic.
Arctic sea ice comes in a beautiful variety of shapes and forms.
For More Information
See NASA.gov
Credits
Please give credit for this item to:
NASA's Goddard Space Flight Center
Image of sea ice melt ponds courtesy of Kathryn Hansen.
Image of Arctic sea ice courtesy of NASA's Digital Mapping System team.
-
Animators
- Trent L. Schindler (USRA)
-
Cindy Starr
(Global Science and Technology, Inc.)

-
Producers
- Jefferson Beck (USRA)
- Malissa Reyes (USRA)
-
Scientist
- Tom Wagner (NASA)
-
Writer
- Patrick Lynch (Wyle Information Systems)
Related
- ID: 10828
 Produced Video
Release date
This page was originally published on Tuesday, September 27, 2011.
This page was last updated on Wednesday, May 3, 2023 at 1:53 PM EDT.