Hurricane Bonnie (1998) 'Crystal Cathedral' View of Precipitation with TRMM Data
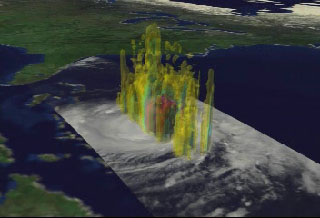
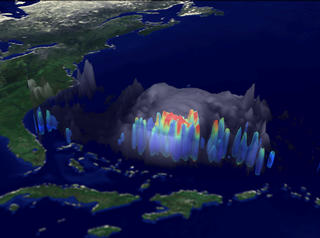
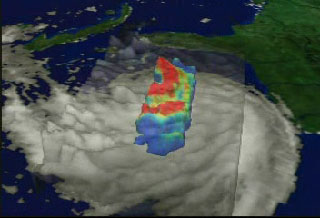
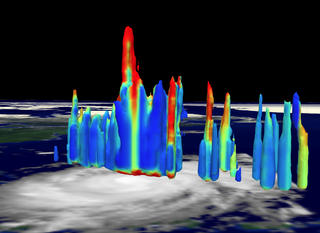
This animation is an early experiment in using transparency for representing precipitation isosurfaces with TRMM data.
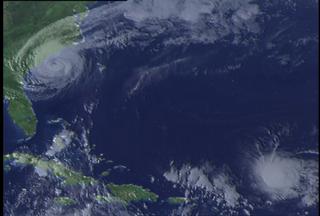
A fly in to a set of nested 3D isosurfaces of constant precipitation density for Hurricane Bonnie, measured by TRMM on August 22, 1998
 'Crystal Cathedral' View of Precipitation from TRMM\".")
Video slate image reads, "Hurricane Bonnie (1998) 'Crystal Cathedral' View of Precipitation from TRMM".
Credits
Please give credit for this item to:
NASA/Goddard Space Flight Center
Scientific Visualization Studio
-
Animators
- Tom Bridgman (Global Science and Technology, Inc.)
- Tom Biddlecome (Raytheon)
-
Greg Shirah
(NASA/GSFC)

-
Scientists
- Chris Kummerow (NASA/GSFC)
- Alan Nelson (NASA/GSFC)
Missions
This page is related to the following missions:Series
This page can be found in the following series:Datasets used
-
[TRMM: PR]
ID: 109 -
[TRMM: VIRS]
ID: 111
Note: While we identify the data sets used on this page, we do not store any further details, nor the data sets themselves on our site.
Related
- ID: 1150
 Visualization
 - ID: 1032
- ID: 209
 Visualization
 - ID: 210
 Visualization
 - ID: 211
- ID: 222

- ID: 227
Release date
This page was originally published on Monday, March 13, 2000.
This page was last updated on Wednesday, May 3, 2023 at 1:58 PM EDT.