VIEW INSIDE MARS REVEALS
|
 |
 |
 |
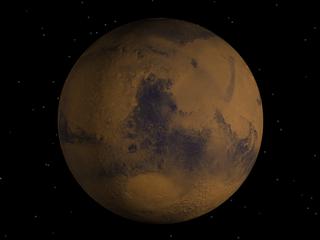
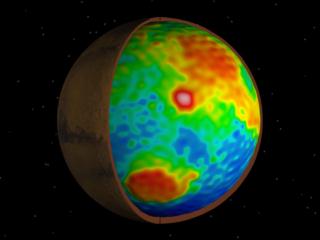
| Mars Surface, Viking Data | Mars Cutaway | Moho Layer |
View High Resolution Mars Cutaway Image
View High Resolution Moho Layer Image
View Cutaway Movie
Some of Mars' best kept secrets, long buried beneath the surface of the red planet, were recently revealed by instruments on NASA's Mars Global Surveyor spacecraft.
New observations of Mars reveal that the planet's flat northern lowlands were an early zone of high heat flow
that later may have been the site of rapid water accumulation, according to a view of the Martian interior
generated using data from Mars Global Surveyor (MGS) spacecraft. Elevation and gravity measurements,
which have been used to probe beneath the surface of Mars, indicate a period of
rapid cooling early in
Martian history, and evidence for large buried channels that could have formed from the flow of enormous
volumes of water.
READ THE NASA PRESS RELEASE
Table Of Contents
- Revealing a Planet - Observations and Inferences Describe Martian Features
- An Asymmetrical Planet - The Martian Mantle
- Subsurface Water Channels - Ancient Clues to a Wetter Martian Surface
- A Working Theory about an Unusual Radiator
- Mapping Martian Gravity - Ingenuity and Precision Yield Exciting Results
- A Tape Measure Made of Light - Mars Orbiter Laser Altimeter (MOLA)
- A Planet of Superlatives - Hellas, Olympus Mons, and Valles Marineris
Revealing a Planet - Observations and Inferences Describe Martian Features
 |
 |
 |
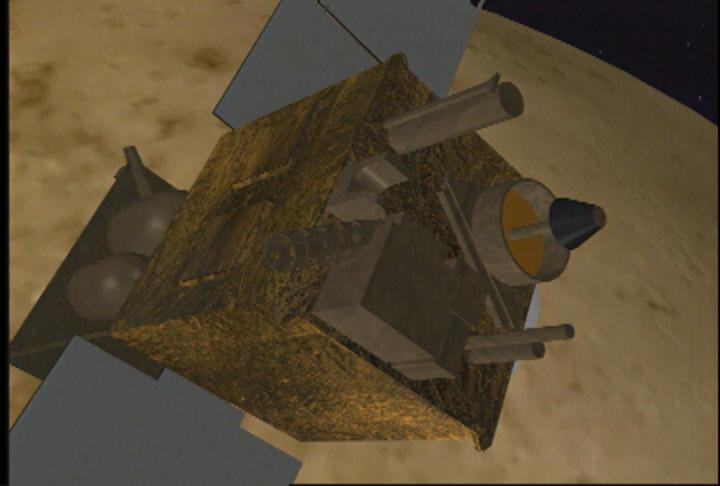
| MGS Spacecraft | Measuring Topography | Measuring Gravity |
|
View High Resolution Image
View the Movie |
View High Resolution Image
View the Movie |
View High Resolution Image
View the Movie |
Researchers using data collected by the Mars Orbiter Laser Altimeter (MOLA) and a clever radio science experiment combined their findings and generated an entirely new map of the planet, providing the first measurements of Mars's crustal thickness. These measurements were inferred by the combination of two observational data sets, namely surface topography and the planet 's gravitational field.
Topography
 |
 |
View High Resolution MOLA Flat Surface Image
View High Resolution MOLA Suface Globe Image
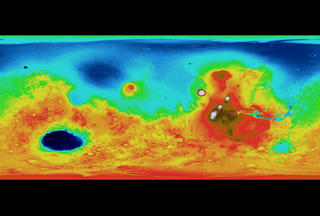
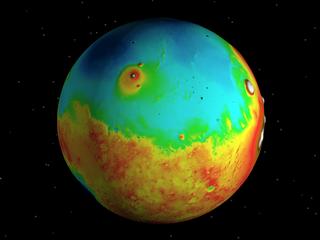
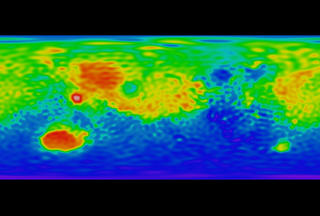
These maps depict topography, or surface features. In these images, white and red
features are highest in relative elevation, while green and blue areas are
lowest.
These images were made possible by data from the Mars Orbiter Laser
Altimeter (MOLA), which bounced a laser off the surface of the planet and
calculated the distance traveled by the beam of light.
Gravitational Field
 |
 |
View High Resolution Gravity Map Globe Image
View Movie
View the How To Derive Gravity Map Movie
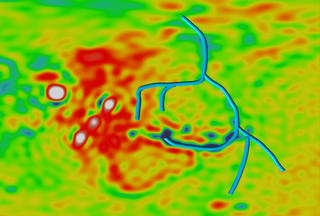
These maps portray observed data describing Mars's gravitational field. Seen here, white and red areas depict regions with the strongest gravitational force, while green and blue areas are the weakest. These images were generated by data reported by the Radio Science Experiment.
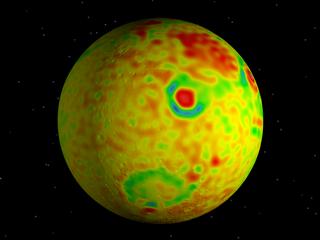
Looking at the Moho--A Map of the Crust
 |
|
View High Resolution Globe Image
View Movie
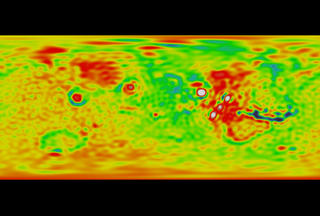
These images portray observed data describing Mars's gravitational field.
These maps are similar to the first two, but with an important
distinction: the data used to create it are based on inferences generated by
combining the topographical and gravitational maps. In these images, blues
indicate thin areas of crust, while red and white indicate thicker areas.
This synthetic visualization clearly shows how comparatively thin the crust
is in the Northern Hemisphere versus the Southern Hemisphere.
The relationship of a planet 's crust to topography and gravity is
complicated, but it 's ultimately related to a geological region called the
"moho", named for Croatian seismologist Andrija Mohorovicic, who first
described it. The moho is the region where the crust and mantle meet. By
determining the thickness of the crust and generating a map of the moho,
scientists are developing a better understanding about the interior
structure of Mars. As described in these images, the moho map does not show
the same sharp resolution of features as do the surface maps. This is
primarily due to the fact that it 's derived from other data, not a map
created by direct observation. The slight undulations that appear in its surface are
actually just digital artifacts of the synthetic process that enabled the
data set to be developed. It quantifies the crustal thickness, but its main
purpose is to work on the issue of why the thickness differences are so
extreme. Project researchers say this adds evidence to the theory that there
may have been an unusual type of convective cooling on Mars when it was a
younger planet. Using this new sub-surface, interior view, scientists have a
window into Mars 's geologic past and the forces that shaped the surface we
see today.
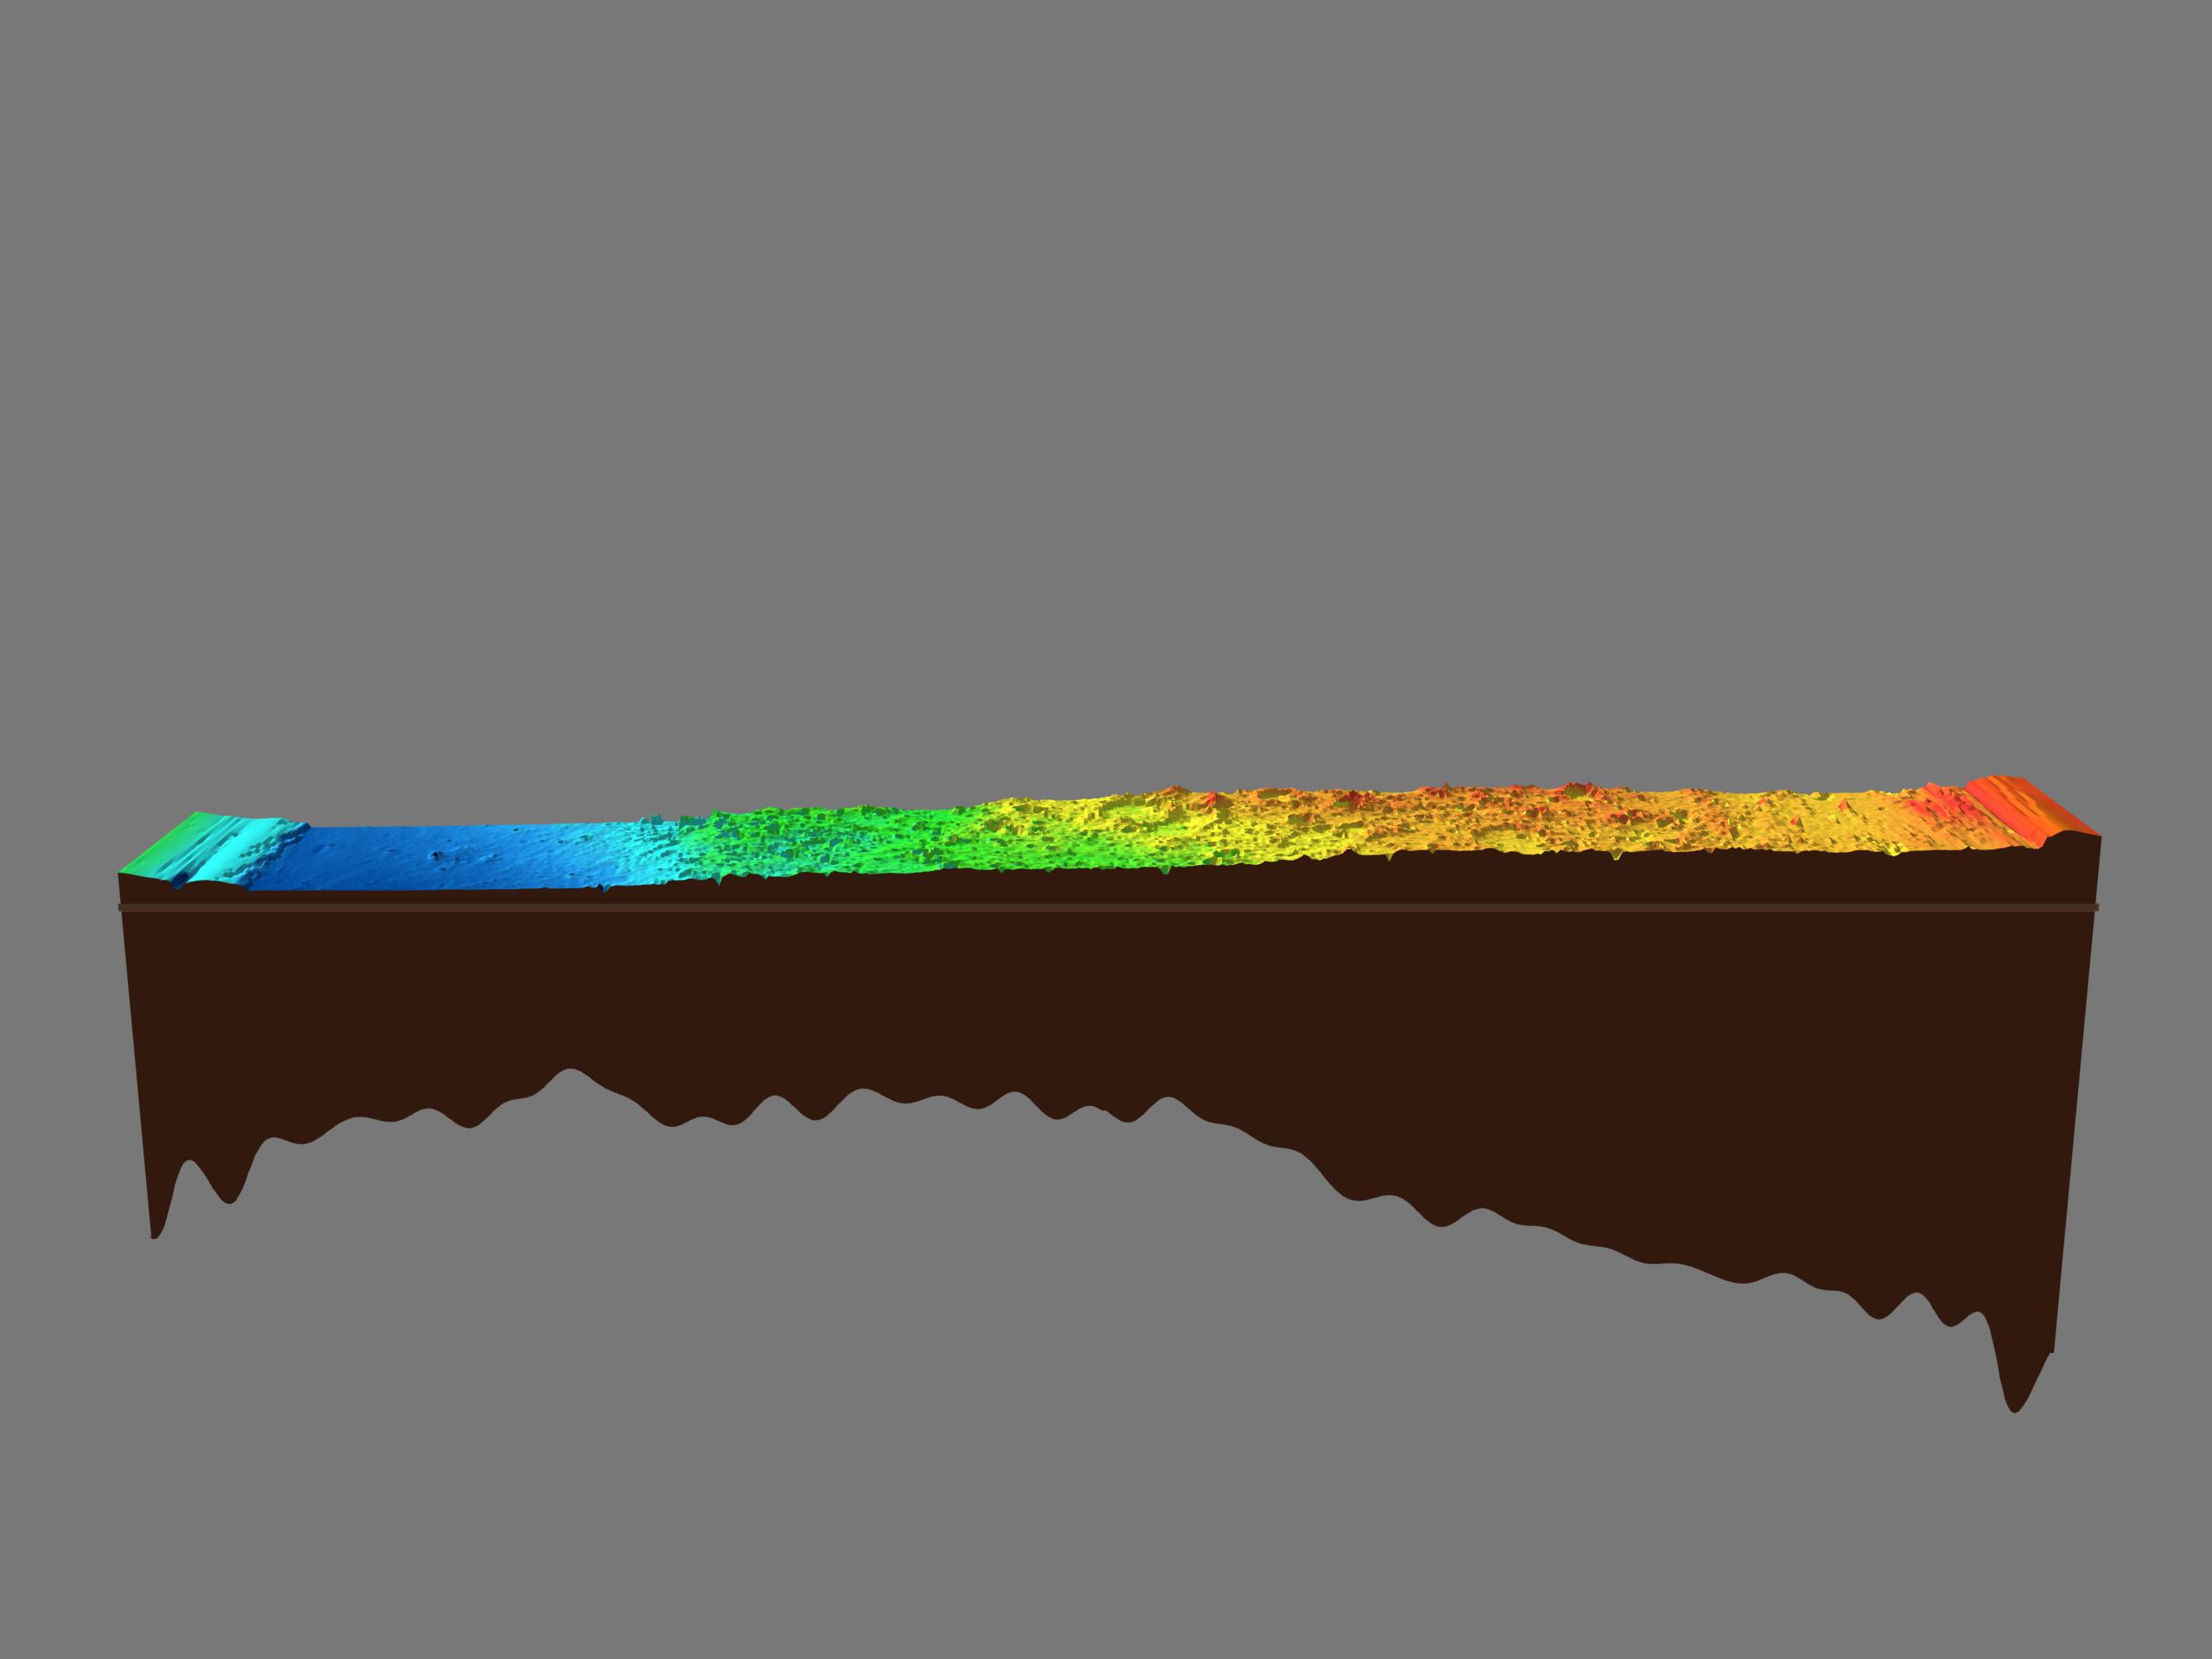
An Asymmetrical Planet -
The Martian Mantle

View High Resolution Crustal Thickness Image
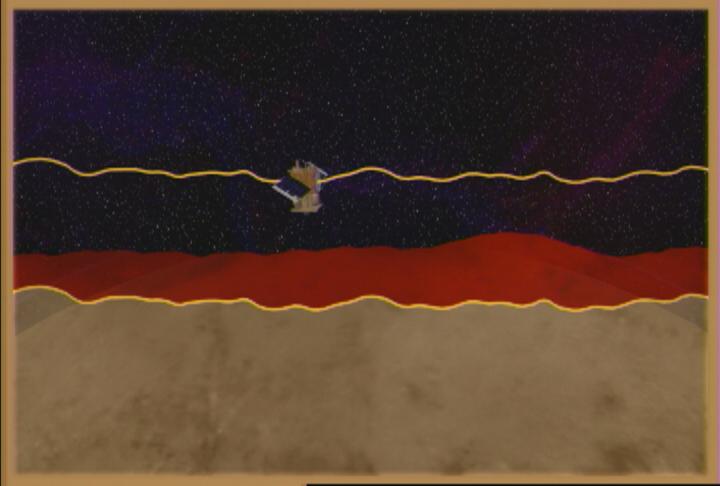
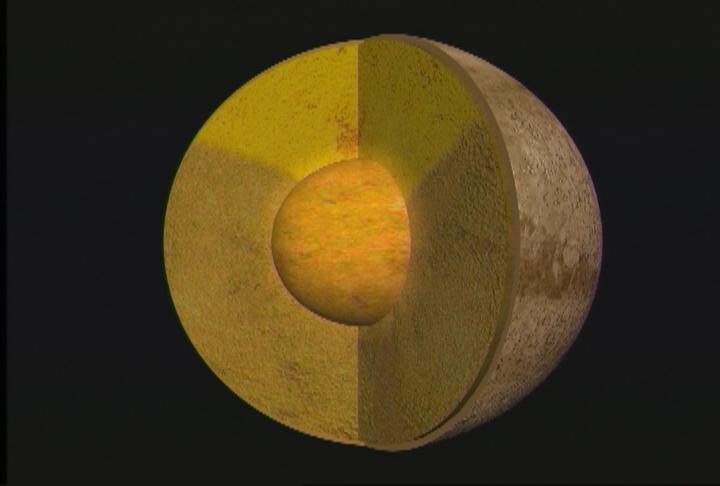
Measurements of Mars 's gravity field, topography, and the subsequently
derived crustal map show the Southern Hemisphere to be significantly thicker
than the North. In this visualization, we show a cutaway of the planet's
skin, with surface features and crustal thickness displayed in relative
sizes to each other. (The features have been exaggerated by a factor of twenty-five times
to make them stand out.) Notice how the crust on the right side of the cross
section appears significantly thicker than the crust on the left. As
discussed in the next section, the dramatic differences from one side of the
planet are likely explained by a fascinating phase in the early states of
Martian development.
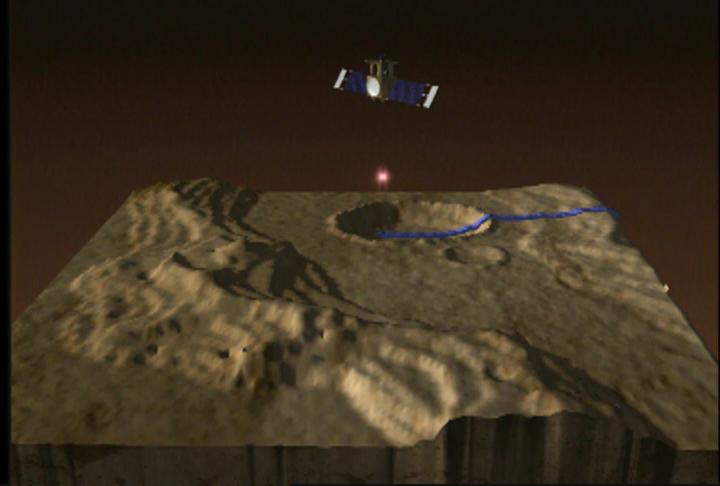
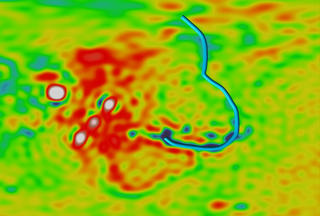
Subsurface Water Channels
- Ancient Clues to a Wetter Martian Surface
 |
 |
View High Resolution Long Water Channel Image
View Movie
Evidence suggests that rapid heat flow in the Northern Hemisphere produced a
wide lowland area there, encouraging the formation of channels, which could
have sluiced water resources into a large basin, even an early ocean. These
images show a network of channels draining from the giant Valles Marineris
into the wide, flat area of the north. Other areas that show similar signs
are The Chryse and Kasei Valles outflow regions. These channels yawn nearly
200 kilometers wide and run more than 1650 kilometers long.
A Working Theory about an
Unusual Radiator
View High Resolution Image
View Movie
The research being released this week about the Martian crust is intended as
a tool for experts to work on questions about the history of the planet. The
dramatic asymmetry in structure suggests that the planet did not cool evenly
for reasons that are still somewhat unclear. The low-lying terrain of the
Northern Hemisphere suggests that Mars might have released more heat from
the north than the south. In other words, the north might have taken longer
to cool. In much the way that pudding forms lumps if it cools quickly, the
south is believed to be higher and lumpier than the north precisely because
it cooled so much faster. With much of the planet 's heat being radiated in
the North, the terrain there formed a smoother, lower average topography,
and therefore a thinner crust.
This puzzling evidence about early Martian convection adds to the
observational signs that Mars may have once had more Earth-like properties,
including the possibility of a northern ocean. Liquid water and other gasses
trapped beneath the Martian surface could have propagated through rocks and
fissures as a result of this rapid heat transfer while the planet cooled.
With a lower Northern Hemisphere, water would have migrated in that
direction, resulting in corresponding outflow channels and networks valleys.
According to the gravity field measurements features interpreted to be
channels lay buried beneath the plains stretching away from the solar
system 's largest valley called Valles Marineris, as well as Mars's immense
Chryse and Kasei Valles outflow regions. These now covered channels may
represent the means for filling an early ocean.
View Mars Core Movie
Mapping Martian Gravity
- Ingenuity and Precision Yield Exciting Results
View High Resolution Image
View Movie
Determining the gravitational map of Mars is not unlike trying to map
weather patterns on Earth by standing on the Moon and using a telescope to
watch a milkweed blossom dance on a spring breeze. Yet it was essentially
just such a cause and effect observation that helped experts draw the
gravitational chart of our planetary neighbor.
Researchers developed this map of the planet's gravity with the simply named
Radio Science Experiment. It worked like this: slight variations in the
expected time required for radio signals to travel between Earth and Mars
pointed to inconsistencies in the planet 's gravitational field. Those
inconsistencies were deduced to be what caused the Surveyor 's orbit to
"wiggle" as it wheeled around the Red Planet, thus causing the transmission
time variations.
If we consider gravity to be a descriptive property of mass, we can see
how contours and ripples in the planet 's crust directly affect the path of
the spacecraft by causing changes to the Martian gravitational field. It is
important to emphasize here that it 's variation in the crust, not surface
topography, which affects the gravitational field. As shown in this
visualization, variations in the crust have a direct relationship to the
orbital track.
The calculations necessary to complete this task were significant, requiring
that a daunting cluster of peripheral factors be taken into account. Some of
these include movement of the planets through the solar system, transmission
anomalies, and the sheer fact that the measurements were being taken from
more than half a billion kilometers away by an instrument only the size of a
small car.
A Tape Measure Made of Light
- Mars Orbiter Laser Altimeter (MOLA)
View Images and Movies
The Mars Orbiter Laser Altimeter (MOLA) has fired a precise beam of
light at the planet it 's circling more than 300 million times. By measuring
the two-way travel time of that laser as it flashes down to the surface and
then as it 's reflected back up to the orbiter, a precise altitude scheme can
be determined and compiled, which then can be converted into a detailed
topographical map. As MOLA has refined its data sets with continuing
collection of topographic data, research continues into the study of Martian
volcanoes, lithospheric features, and possible routes where water might have
moved across the surface.
To keep track of the MOLA laser's progress as it continues to rack up
measurements, click here.
Click Here for Page Two
This multimedia project is the work of a dedicated team of researchers, animators, and media specialists. A companion video to this web site is available from NASA-TV. Below are a list of agencies, departments, and researchers who provided expertise and data for this production:
Please give credit for these images to:
NASA - Goddard Space Flight Center
Scientific Visualization Studio
Television Production NASA-TV/GSFC
The MOLA Instrument and Science Team
Content Preparation and Project Production: Michael Starobin
Last Revised: February 4, 2019 at 06:02 PM EST