Earth
ID: 4433
Every two to seven years, an unusually warm pool of water -- sometimes two to three degrees Celsius higher than normal -- develops across the eastern tropical Pacific Ocean to create a natural short-term climate change event. This warm condition, known as El Niño, affects the local aquatic environment, but also spurs extreme weather patterns around the world, from flooding in California to droughts in Australia.
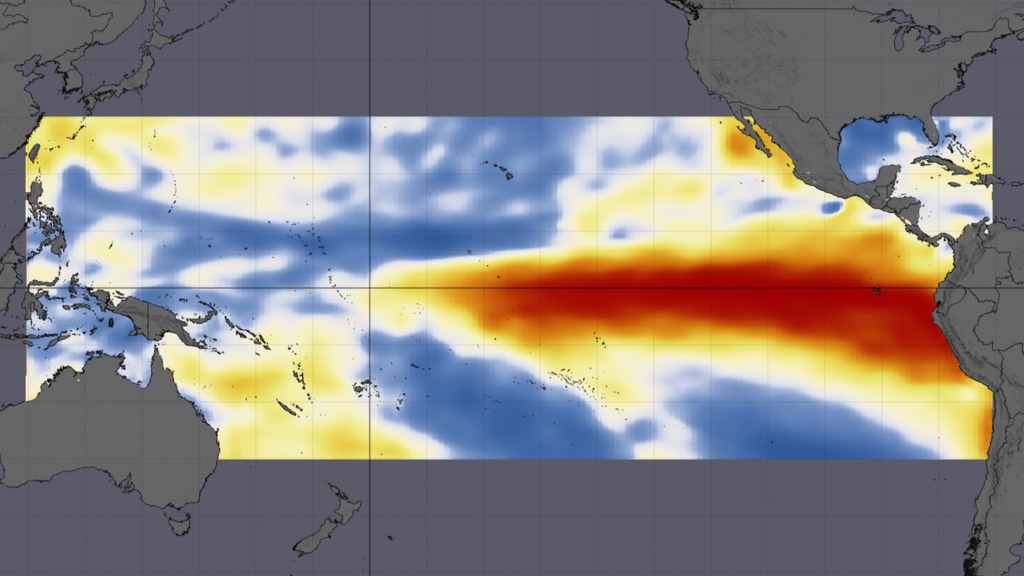
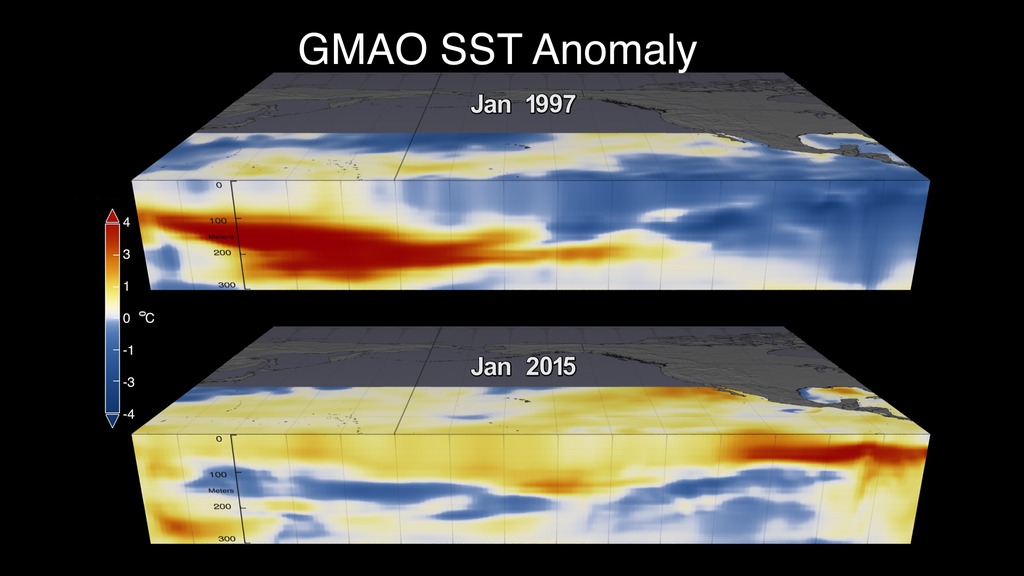
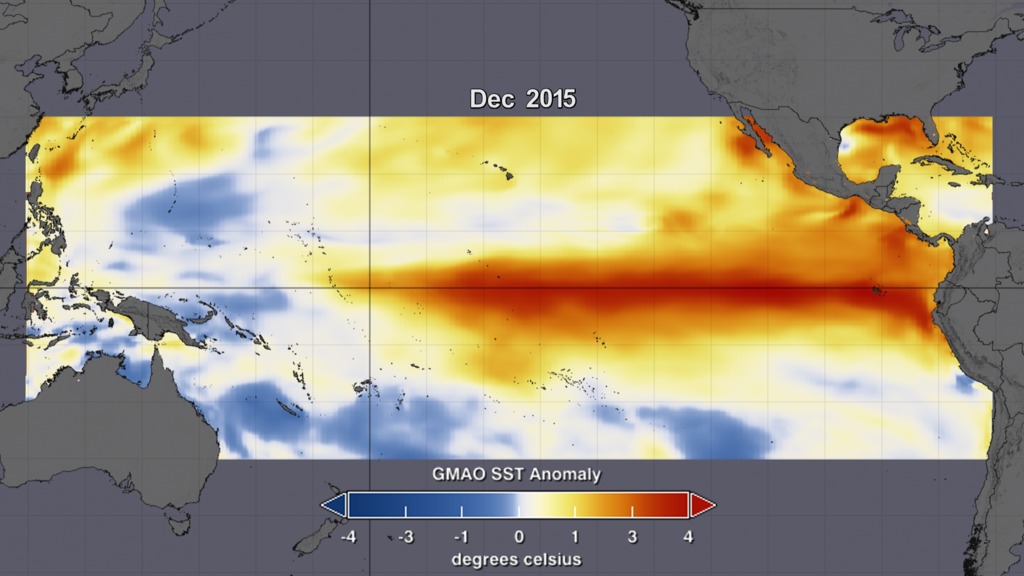
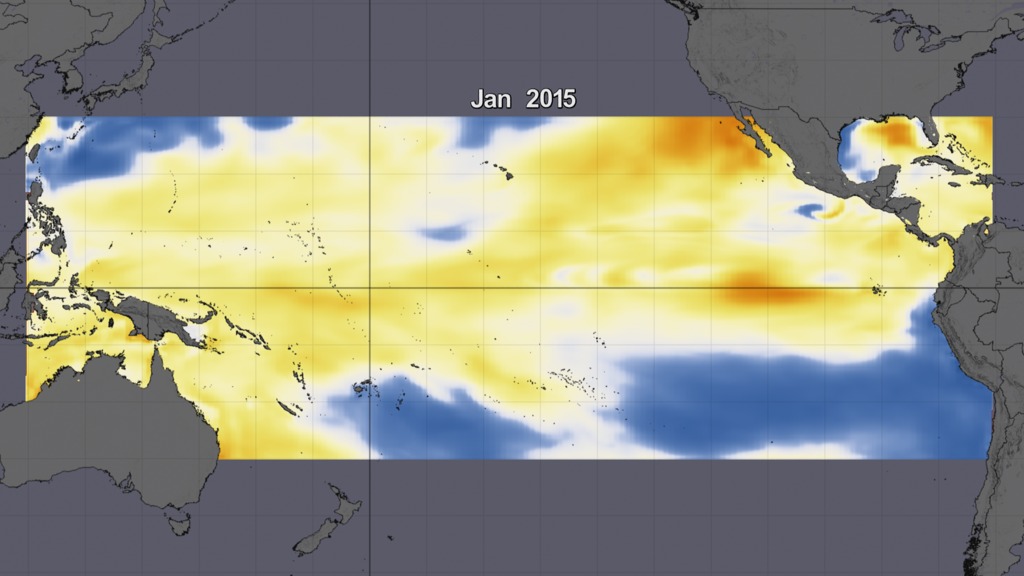
In 2015 El Niño unfolded in the Pacific Ocean, as sea surface temperatures create different patterns than seen in the 1997-1998 El Niño. Computer models are just one tool that NASA scientists are using to study this large El Nino event, and compare it to other events in the past."The start of an El Niño is important," said Robin Kovach, a research scientist with the Global Modeling and Assimilation Office (GMAO) at NASA's Goddard Space Flight Center in Greenbelt, Maryland. The visualization shows how the 1997 event started from colder-than-average sea surface temperatures – but the 2015 event started with warmer-than-average temperatures not only in the Pacific but also in in the Atlantic and Indian Oceans."The '97 El Niño was much stronger in the Eastern Pacific, with much warmer water up to the coast of South America," Kovach said. In 2015, the warmest waters are instead in the Central Pacific and extend west of the International Date Line.
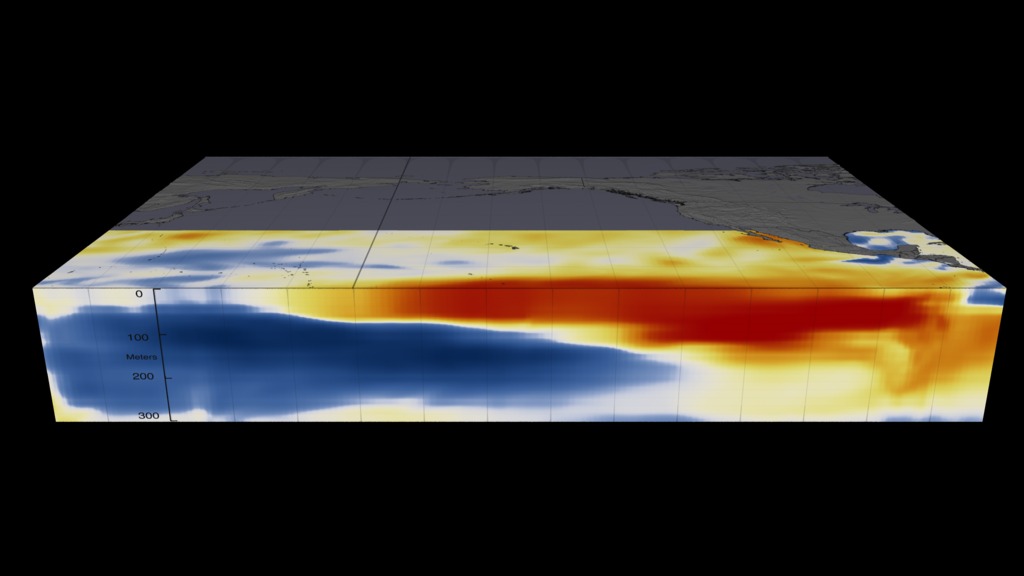
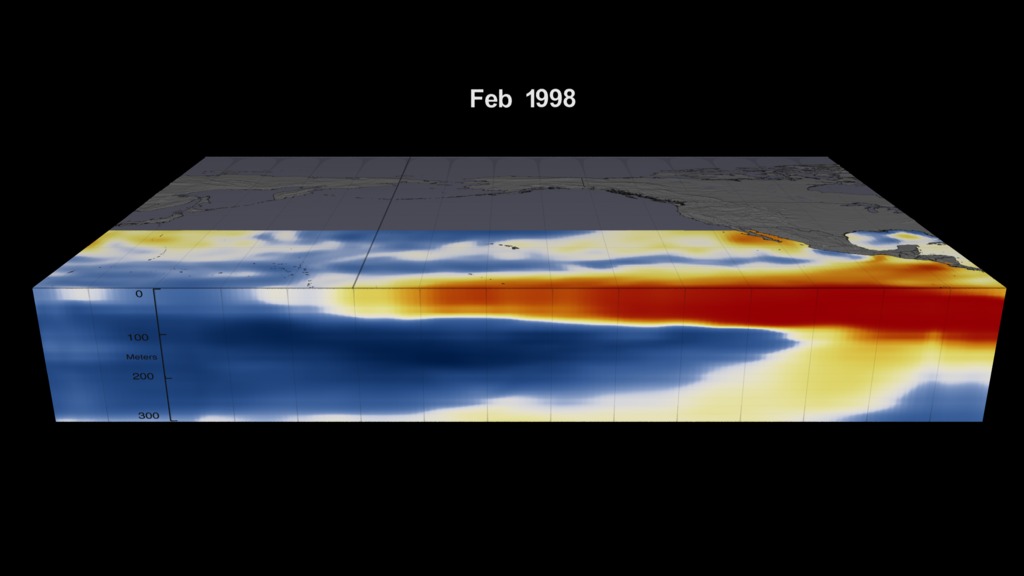
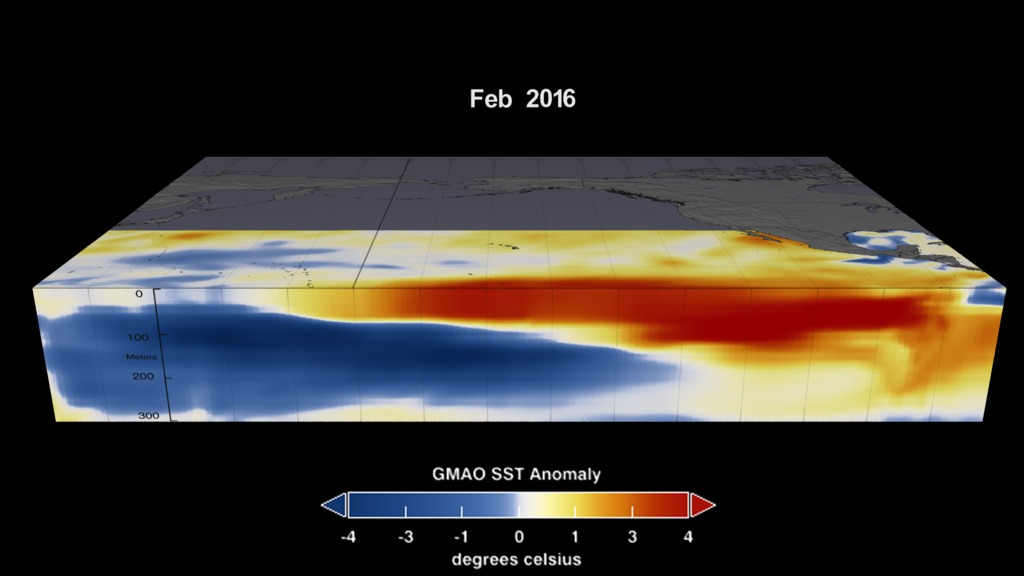
The water temperature variations typical of El Niño are not only at the surface of the equatorial Pacific, but below the surface as well. And these variations were also different in 2015, compared to 1997. At the height of the El Niño in November, colder-than-average temperatures in the Western Pacific and warmer-than-average temperatures in the Eastern Pacific were stronger and extended deeper in 1997 than in 2015. Goddard’s computer models, with input from ocean buoys, atmospheric models, satellite data and other sources, can also simulate what ocean water temperatures could do in the coming months. The GMAO seasonal forecast, which takes 18 hours to complete, and creates more than nine terabytes of data, shows that this 2015 El Niño could be different until the end. "In the past, very strong El Niño events typically transition to neutral conditions and then a La Niña event," said Kovach. February computer model runs forecast a return to normal sea surface temperatures by June. The latest Feb 5, 2016 forecast does not yet predict below normal sea surface temperatures that would result in a large La Niña. As of Feb. 14, 2016, the latest ocean computer model shows colder-than-average water temperatures off the South American coast from Ecuador to Panama. "This current El Niño has been different so it will be interesting to see what happens in the next forecast and the coming months."
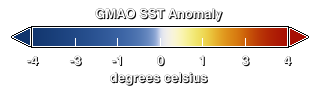


El Niño: GMAO Daily Sea Surface Temperature Anomaly from 1997/1998 and 2015/2016
In 2015 El Niño unfolded in the Pacific Ocean, as sea surface temperatures create different patterns than seen in the 1997-1998 El Niño. Computer models are just one tool that NASA scientists are using to study this large El Nino event, and compare it to other events in the past."The start of an El Niño is important," said Robin Kovach, a research scientist with the Global Modeling and Assimilation Office (GMAO) at NASA's Goddard Space Flight Center in Greenbelt, Maryland. The visualization shows how the 1997 event started from colder-than-average sea surface temperatures – but the 2015 event started with warmer-than-average temperatures not only in the Pacific but also in in the Atlantic and Indian Oceans."The '97 El Niño was much stronger in the Eastern Pacific, with much warmer water up to the coast of South America," Kovach said. In 2015, the warmest waters are instead in the Central Pacific and extend west of the International Date Line.
The water temperature variations typical of El Niño are not only at the surface of the equatorial Pacific, but below the surface as well. And these variations were also different in 2015, compared to 1997. At the height of the El Niño in November, colder-than-average temperatures in the Western Pacific and warmer-than-average temperatures in the Eastern Pacific were stronger and extended deeper in 1997 than in 2015. Goddard’s computer models, with input from ocean buoys, atmospheric models, satellite data and other sources, can also simulate what ocean water temperatures could do in the coming months. The GMAO seasonal forecast, which takes 18 hours to complete, and creates more than nine terabytes of data, shows that this 2015 El Niño could be different until the end. "In the past, very strong El Niño events typically transition to neutral conditions and then a La Niña event," said Kovach. February computer model runs forecast a return to normal sea surface temperatures by June. The latest Feb 5, 2016 forecast does not yet predict below normal sea surface temperatures that would result in a large La Niña. As of Feb. 14, 2016, the latest ocean computer model shows colder-than-average water temperatures off the South American coast from Ecuador to Panama. "This current El Niño has been different so it will be interesting to see what happens in the next forecast and the coming months."
Used Elsewhere In

Related

For More Information
Visualization Credits
Lori Perkins (NASA/GSFC): Lead Data Visualizer
Robin Kovach (SSAI): Lead Scientist
Steven Pawson (NASA/GSFC): Lead Scientist
Michelle Handleman (USRA): Producer
Kayvon Sharghi (USRA): Producer
Kate Ramsayer (Telophase): Lead Writer
Robin Kovach (SSAI): Lead Scientist
Steven Pawson (NASA/GSFC): Lead Scientist
Michelle Handleman (USRA): Producer
Kayvon Sharghi (USRA): Producer
Kate Ramsayer (Telophase): Lead Writer
Please give credit for this item to:
NASA's Scientific Visualization Studio
The GEOS-5 data used in this study/project have been provided by the Global Modeling and Assimilation Office (GMAO) at NASA Goddard Space Flight Center through the online data portal in the NASA Center for Climate Simulation
NASA's Scientific Visualization Studio
The GEOS-5 data used in this study/project have been provided by the Global Modeling and Assimilation Office (GMAO) at NASA Goddard Space Flight Center through the online data portal in the NASA Center for Climate Simulation
Short URL to share this page:
https://svs.gsfc.nasa.gov/4433
Data Used:
Note: While we identify the data sets used in these visualizations, we do not store any further details nor the data sets themselves on our site.
This item is part of this series:
El Niño and La Niña
Keywords:
SVS >> Computer Model
SVS >> El Nino
SVS >> Simulation
SVS >> Hyperwall
SVS >> GMAO
NASA Science >> Earth
NASA Earth Science Focus Areas >> Climate Variability and Change
https://svs.gsfc.nasa.gov/4433
Data Used:
also referred to as: GMAO SST Anomaly
Model - NASA GMAOThis item is part of this series:
El Niño and La Niña
Keywords:
SVS >> Computer Model
SVS >> El Nino
SVS >> Simulation
SVS >> Hyperwall
SVS >> GMAO
NASA Science >> Earth
NASA Earth Science Focus Areas >> Climate Variability and Change


