Cyclone Winston Slams Fiji (February 20, 2016)
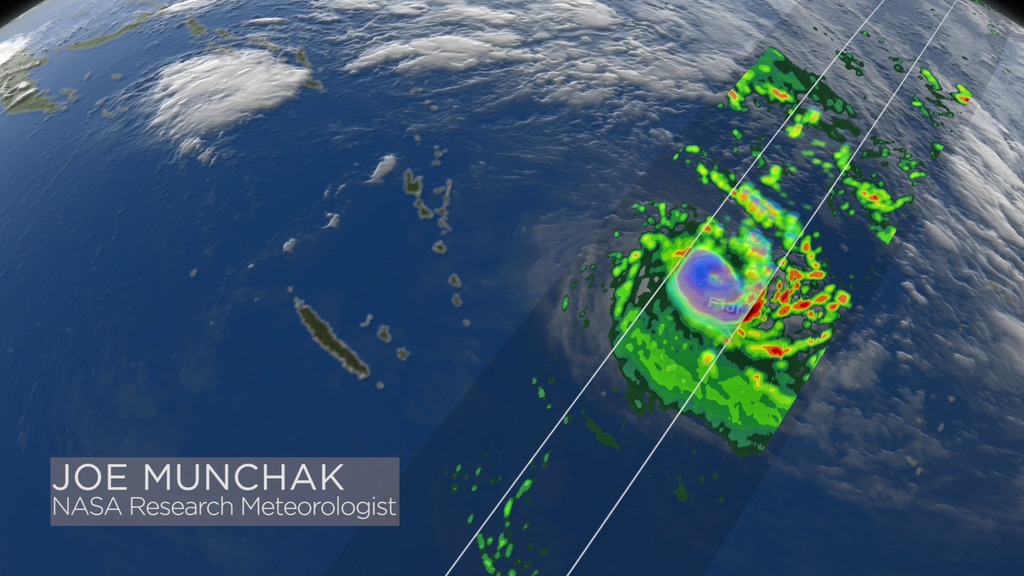
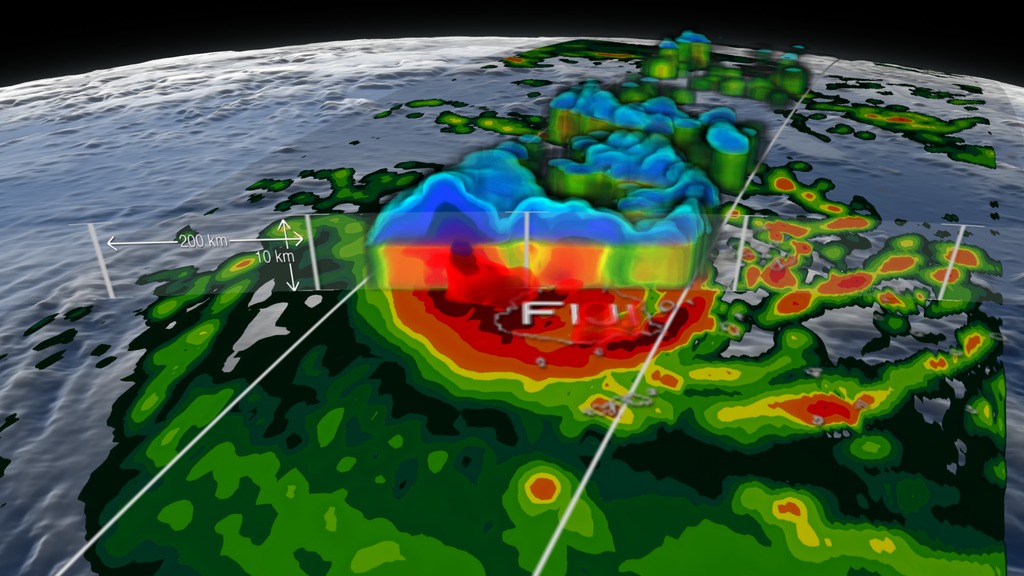
This animation begins with NOAA Cloud Cover Composite (CPC) data that depicts Tropical Cyclone Winston barrelling towards the Fiji Islands. As the camera zooms in, GPM's GPROF data reveals surface rain rates. GPM's DPR 3D volumetric precipitation structure quickly dissolves in to show the entire precipitation structure of Winston. The camera then moves down to the side of the storm to show it's profile, revealing the height of Winston's massive precipitation structures. As the camera moves up and around, Winston is dissected, revealing the heavy precipitation structure surrounding the Cyclone's eye. The camera then finally pulls back, while Winston's outer precipitation structures are draped back over to get one final top down view of the Cyclone over Fiji.
The NASA GPM satellite passed directly over Tropical Cyclone Winston just after it made landfall on the north coast of Viti Levu Island, which is the largest and most populated island in the nation of Fiji. At the time, Winston was one of the most intense tropical cyclones observed in the South Pacific Ocean, and took an unusual track on the way to Fiji, completing a large counter-clockwise loop during the preceding week.
NASA's GPM satellite is designed to measure rainfall using both passive microwave (GMI) and radar (DPR) instruments. GMI measuremensts are sensitive to the column-integrated rain and ice water, and cover a wide swath, whereas the DPR can observe 3D structures of radar signals reflected by rain and snow in a narrower swath. In this animation, the GMI rainfall estimates are shown at the earth's surface below the 3D storm structure revealed by DPR.

Color bar for frozen precipitation rates (ie, snow rates). Shades of cyan represent low amounts of frozen precipitation, whereas shades of purple represent high amounts of precipitation.
Color bar for liquid precipitation rates (ie, rain rates). Shades of green represent low amounts of liquid precipitation, whereas shades of red represent high amounts of precipitation.
Print resolution view of Winston as it barrels toward the Fiji Islands.
Print resolution bird's eye view of Winston as it hits the Fiji Islands.
Print resolution side view of Winston showing the tall precipitation structures towering nearly 15 kilometers above sea level.
Print resolution image of Winston being bisected to reveal the heavy internal rain structure around the eye.
Print resolution still showing Winston's internal (heavy) precipitation structure around the cyclone eye.
Credits
Please give credit for this item to:
NASA's Scientific Visualization Studio
-
Visualizer
- Alex Kekesi (Global Science and Technology, Inc.)
-
Producers
- Ryan Fitzgibbons (USRA)
- Rani Gran (NASA/GSFC)
-
Scientists
- Gail Skofronick Jackson (NASA/GSFC)
- George Huffman (NASA/GSFC)
- Stephen J. Munchak (University of Maryland)
- Chris Kidd (University of Maryland)
- Dalia B Kirschbaum (NASA/GSFC)
Release date
This page was originally published on Monday, February 29, 2016.
This page was last updated on Tuesday, November 14, 2023 at 12:07 AM EST.
Missions
This visualization is related to the following missions:Series
This visualization can be found in the following series:Datasets used in this visualization
-
CPC (Climate Prediction Center) Cloud Composite
ID: 600Global cloud cover from multiple satellites
See all pages that use this dataset -
Rain Rates (Surface Precipitation) [GPM: GMI]
ID: 822Credit: Data provided by the joint NASA/JAXA GPM mission.
See all pages that use this dataset -
Volumetric Precipitation data (Ku) [GPM: DPR]
ID: 830Credit: Data provided by the joint NASA/JAXA GPM mission.
See all pages that use this dataset
Note: While we identify the data sets used in these visualizations, we do not store any further details, nor the data sets themselves on our site.
Related
- ID: 12164
 Produced Video
Alternate Versions
- ID: 4437
 Visualization