Earth
ID: 4410
A collection of hyperwall shows used in the 2015 meeting of the American Geophysical Union.
For context and additional information: NASA Images Show Human Fingerprint on Global Air Quality
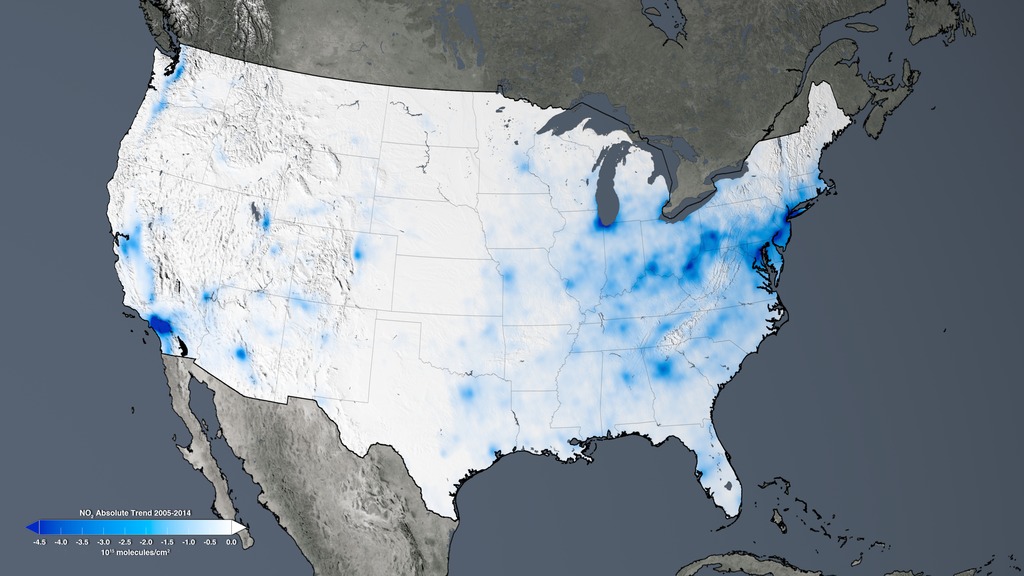
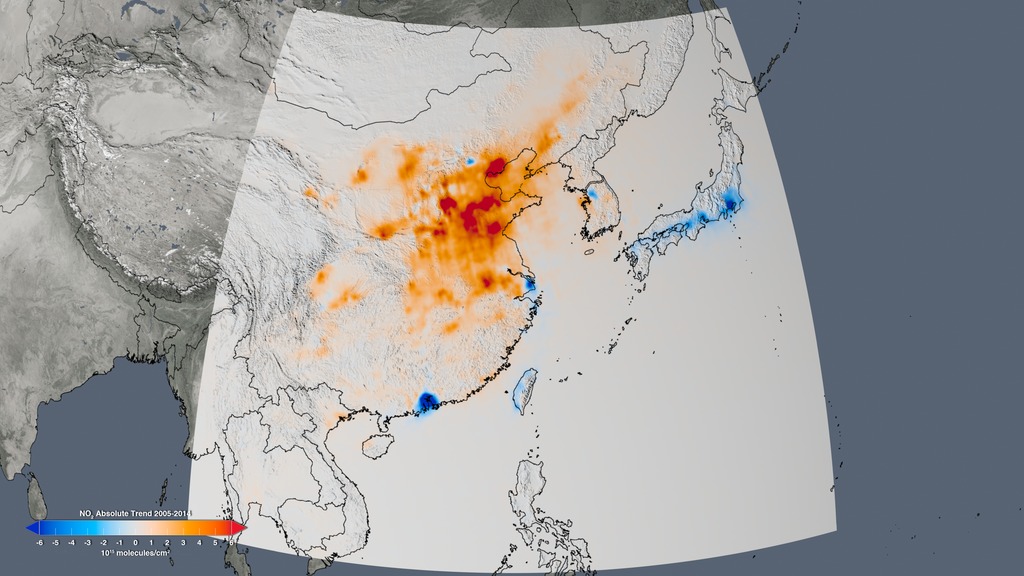

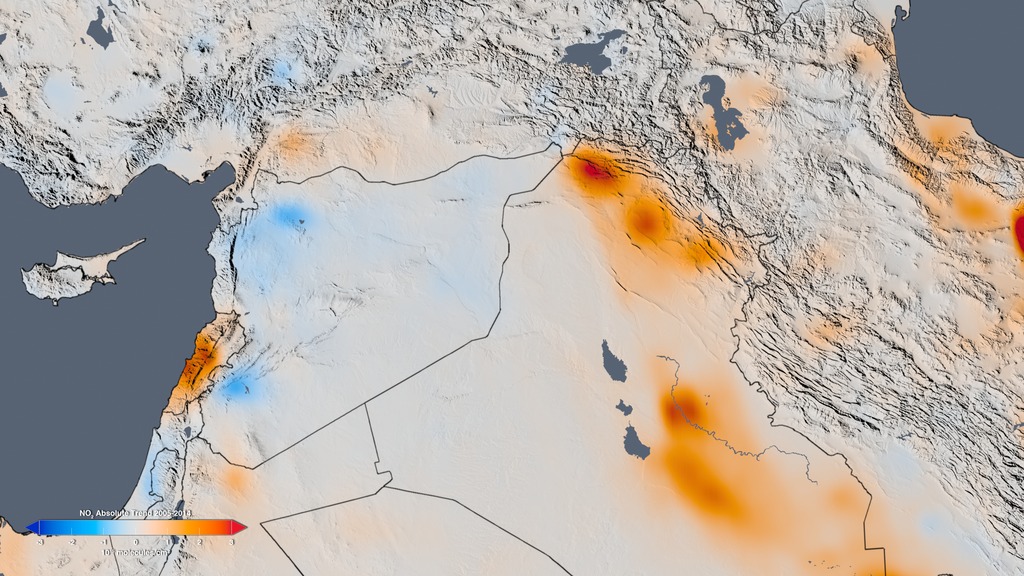
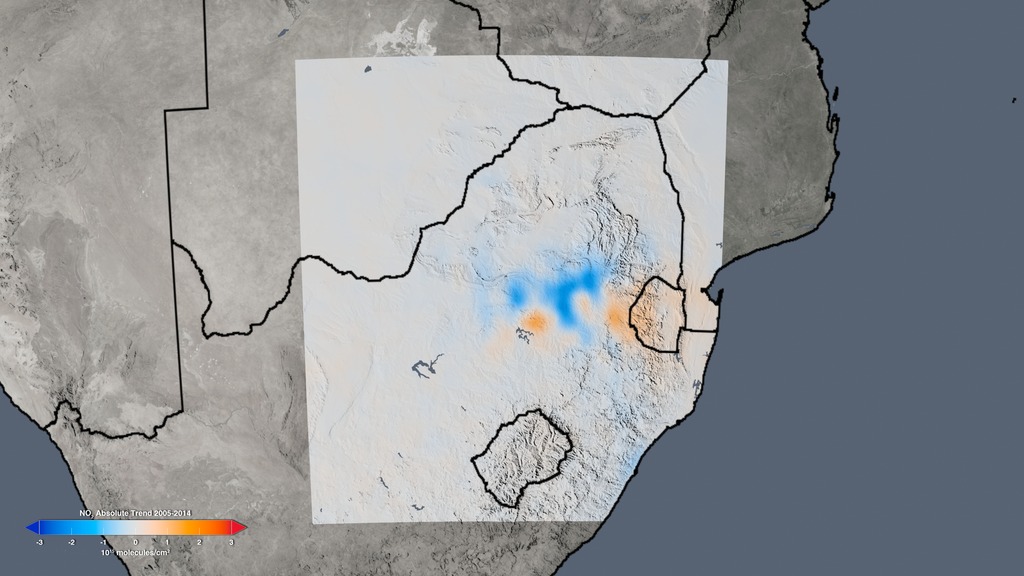
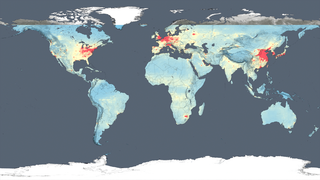
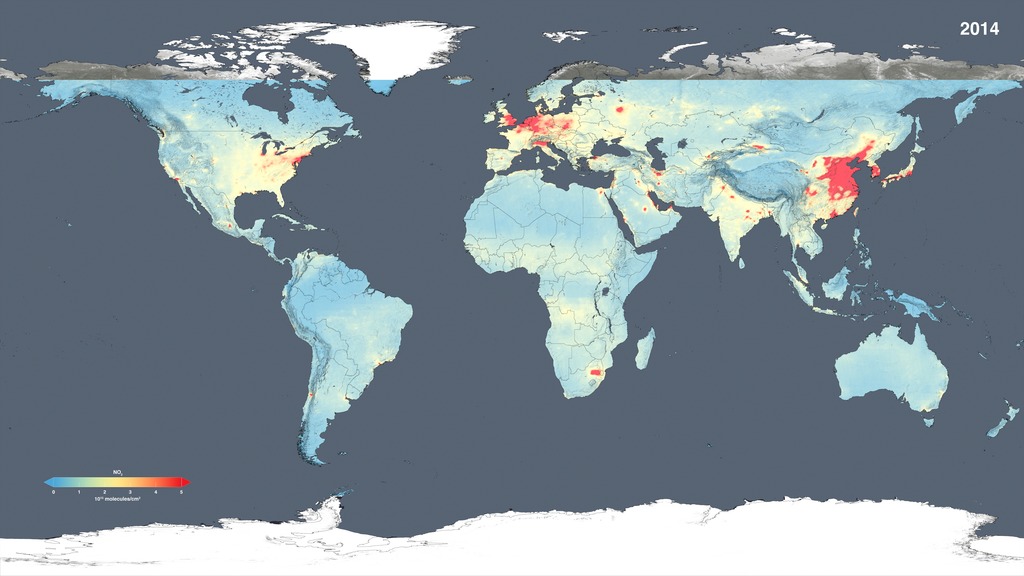
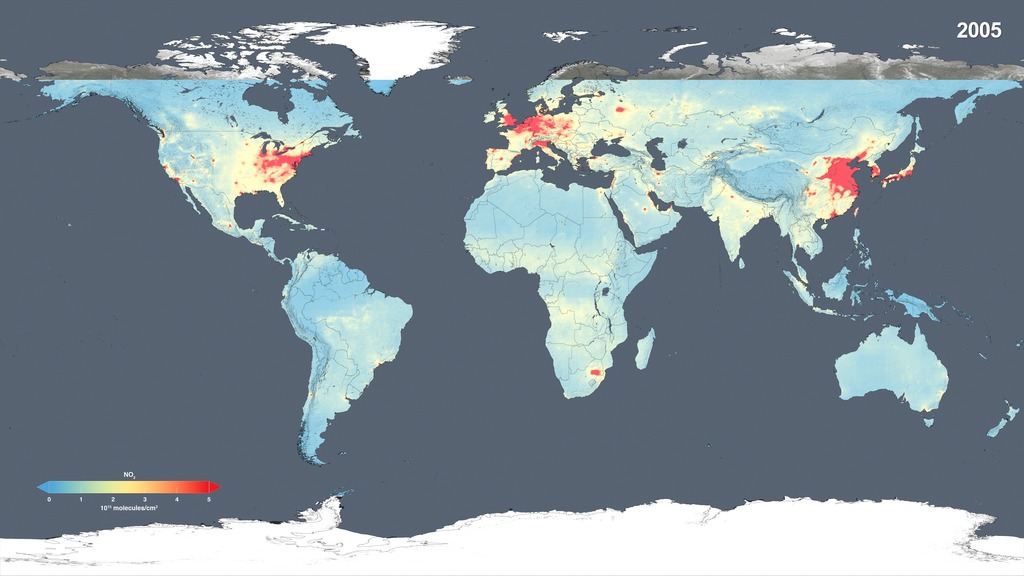
2005-2014 NO₂ Hyperwall Shows
For context and additional information: NASA Images Show Human Fingerprint on Global Air Quality
Source Material
Visualization Credits
Trent L. Schindler (USRA): Lead Visualizer
Bryan Duncan (NASA/GSFC): Lead Scientist
Ellen T. Gray (ADNET Systems, Inc.): Lead Writer
Kayvon Sharghi (USRA): Lead Producer
Lok Lamsal (USRA): Scientist
Bryan Duncan (NASA/GSFC): Lead Scientist
Ellen T. Gray (ADNET Systems, Inc.): Lead Writer
Kayvon Sharghi (USRA): Lead Producer
Lok Lamsal (USRA): Scientist
Please give credit for this item to:
NASA's Scientific Visualization Studio
NASA's Scientific Visualization Studio
Short URL to share this page:
https://svs.gsfc.nasa.gov/4410
Missions:
Aura
Earth Probe Total Ozone Mapping Spectrometer (EP-TOMS)
Data Used: Note: While we identify the data sets used in these visualizations, we do not store any further details nor the data sets themselves on our site.
Keywords:
SVS >> HDTV
SVS >> Hyperwall
NASA Science >> Earth
SVS >> Presentation


