Earth
ID: 4367
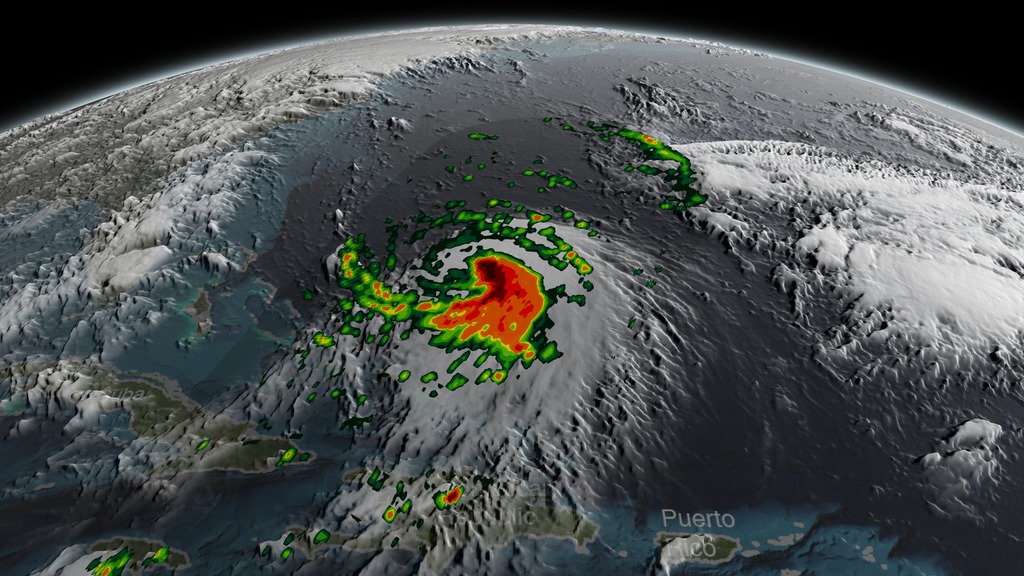
Joaquin became a tropical storm on the evening (EDT) of Monday, September 28th midway between the Bahamas and Bermuda and has now formed into a hurricane, the 3rd of the season--the difference is Joaquin could impact the US East Coast.
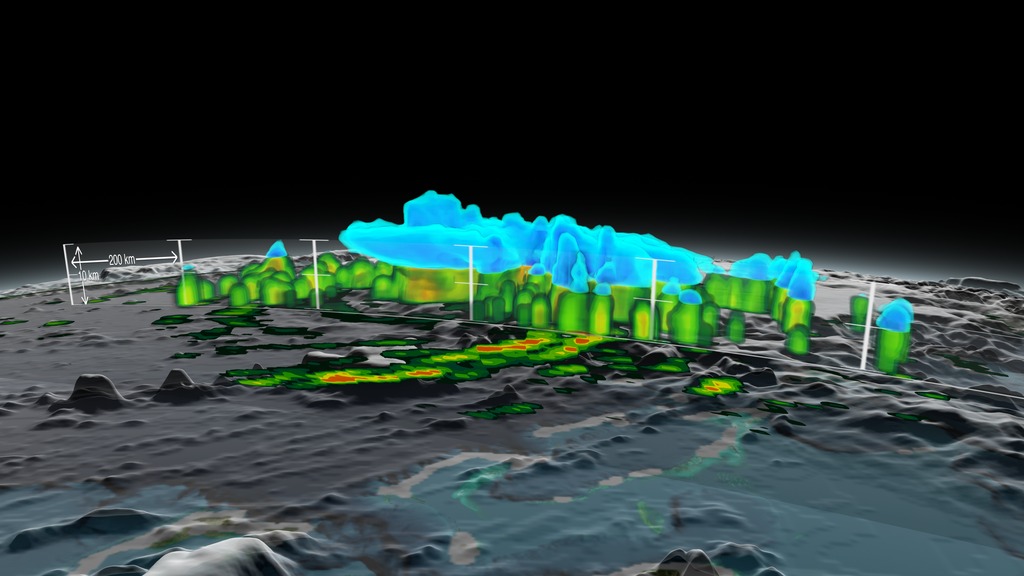
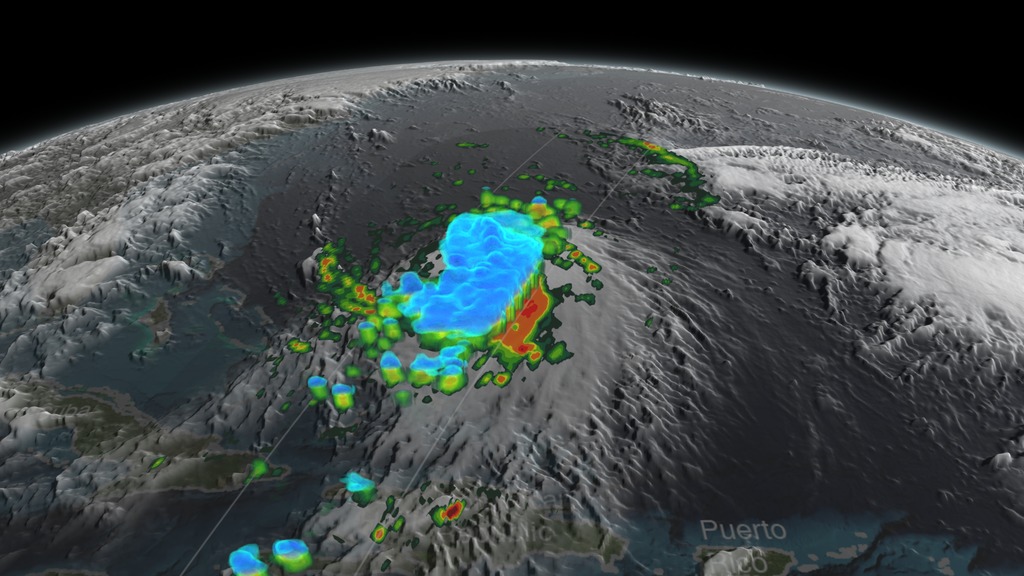
GPM captured Joaquin Tuesday, September 29th at 21:39 UTC (5:39 pm EDT) as the hurricane moved slowly towards the west-southwest about 400 miles east of the Bahamas. At the time, Joaquin had been battling northerly wind shear, which was impeding the storm's ability to strengthen. However, compared to earlier in the day, the system was beginning to gain the upper hand as the shear began to relax its grip. At the time of this data visualization, Joaquin's low-level center of circulation was located further within the cloud shield, and the rain area was beginning to wrap farther around the center on the eastern side of the storm while showing signs of increased banding and curvature, a sure sign that Joaquin's circulation was intensifying. GPM shows a large area of very intense rain with rain rates ranging from around 50 to 132 mm/hr (~2 to 5 inches, shown in shades of red) just to the right of the center. This is a strong indication that large amounts of heat are being released into the storm's center, fueling its circulation and providing the means for its intensification. Associated with the area of intense rain is an area of tall convective towers, known as a convective burst, with tops reaching up to 16.3 km. These towers when located near the storm's core are a strong indication that the storm is poised to strengthen as they too reveal the release of heat into the storm.
At the time this data was taken, the National Hurricane Center reported that Joaquin's maximum sustained winds had increased to 65 mph from 40 mph earlier in the day, making Joaquin a strong tropical storm but poised to become a hurricane, which did occur on September 30th at 8:00 am EDT.


Joaquin
GPM captured Joaquin Tuesday, September 29th at 21:39 UTC (5:39 pm EDT) as the hurricane moved slowly towards the west-southwest about 400 miles east of the Bahamas. At the time, Joaquin had been battling northerly wind shear, which was impeding the storm's ability to strengthen. However, compared to earlier in the day, the system was beginning to gain the upper hand as the shear began to relax its grip. At the time of this data visualization, Joaquin's low-level center of circulation was located further within the cloud shield, and the rain area was beginning to wrap farther around the center on the eastern side of the storm while showing signs of increased banding and curvature, a sure sign that Joaquin's circulation was intensifying. GPM shows a large area of very intense rain with rain rates ranging from around 50 to 132 mm/hr (~2 to 5 inches, shown in shades of red) just to the right of the center. This is a strong indication that large amounts of heat are being released into the storm's center, fueling its circulation and providing the means for its intensification. Associated with the area of intense rain is an area of tall convective towers, known as a convective burst, with tops reaching up to 16.3 km. These towers when located near the storm's core are a strong indication that the storm is poised to strengthen as they too reveal the release of heat into the storm.
At the time this data was taken, the National Hurricane Center reported that Joaquin's maximum sustained winds had increased to 65 mph from 40 mph earlier in the day, making Joaquin a strong tropical storm but poised to become a hurricane, which did occur on September 30th at 8:00 am EDT.
Related
Visualization Credits
Kel Elkins (USRA): Lead Visualizer
Alex Kekesi (Global Science and Technology, Inc.): Lead Visualizer
Gail Skofronick Jackson (NASA/GSFC): Lead Scientist
George Huffman (NASA/GSFC): Lead Scientist
Dalia B Kirschbaum (NASA/GSFC): Lead Scientist
Rani Gran (NASA/GSFC): Producer
Ryan Fitzgibbons (USRA): Lead Producer
Stephen Lang (NASA/GSFC): Writer
Please give credit for this item to:
NASA's Scientific Visualization Studio
NASA's Scientific Visualization Studio
Short URL to share this page:
https://svs.gsfc.nasa.gov/4367
Mission:
Global Precipitation Measurement (GPM)
Data Used:
Note: While we identify the data sets used in these visualizations, we do not store any further details nor the data sets themselves on our site.
This item is part of this series:
GPM Animations
Keywords:
DLESE >> Atmospheric science
SVS >> Tropical Storm
GCMD >> Earth Science >> Atmosphere >> Precipitation >> Rain
SVS >> Hyperwall
NASA Science >> Earth
SVS >> Presentation
GCMD keywords can be found on the Internet with the following citation: Olsen, L.M., G. Major, K. Shein, J. Scialdone, S. Ritz, T. Stevens, M. Morahan, A. Aleman, R. Vogel, S. Leicester, H. Weir, M. Meaux, S. Grebas, C.Solomon, M. Holland, T. Northcutt, R. A. Restrepo, R. Bilodeau, 2013. NASA/Global Change Master Directory (GCMD) Earth Science Keywords. Version 8.0.0.0.0
https://svs.gsfc.nasa.gov/4367
Mission:
Global Precipitation Measurement (GPM)
Data Used:
GPM/GMI/Surface Precipitation also referred to as: Rain Rates
9/29/2015 21:36Z
Credit:
Data provided by the joint NASA/JAXA GPM mission.
Data provided by the joint NASA/JAXA GPM mission.
GPM/DPR/Ku also referred to as: Volumetric Precipitation data
Observed Data - JAXA - 9/29/2015 21:36Z
Credit:
Data provided by the joint NASA/JAXA GPM mission.
Data provided by the joint NASA/JAXA GPM mission.
This item is part of this series:
GPM Animations
Keywords:
DLESE >> Atmospheric science
SVS >> Tropical Storm
GCMD >> Earth Science >> Atmosphere >> Precipitation >> Rain
SVS >> Hyperwall
NASA Science >> Earth
SVS >> Presentation
GCMD keywords can be found on the Internet with the following citation: Olsen, L.M., G. Major, K. Shein, J. Scialdone, S. Ritz, T. Stevens, M. Morahan, A. Aleman, R. Vogel, S. Leicester, H. Weir, M. Meaux, S. Grebas, C.Solomon, M. Holland, T. Northcutt, R. A. Restrepo, R. Bilodeau, 2013. NASA/Global Change Master Directory (GCMD) Earth Science Keywords. Version 8.0.0.0.0


