Maximum Antarctic Sea Ice 2015

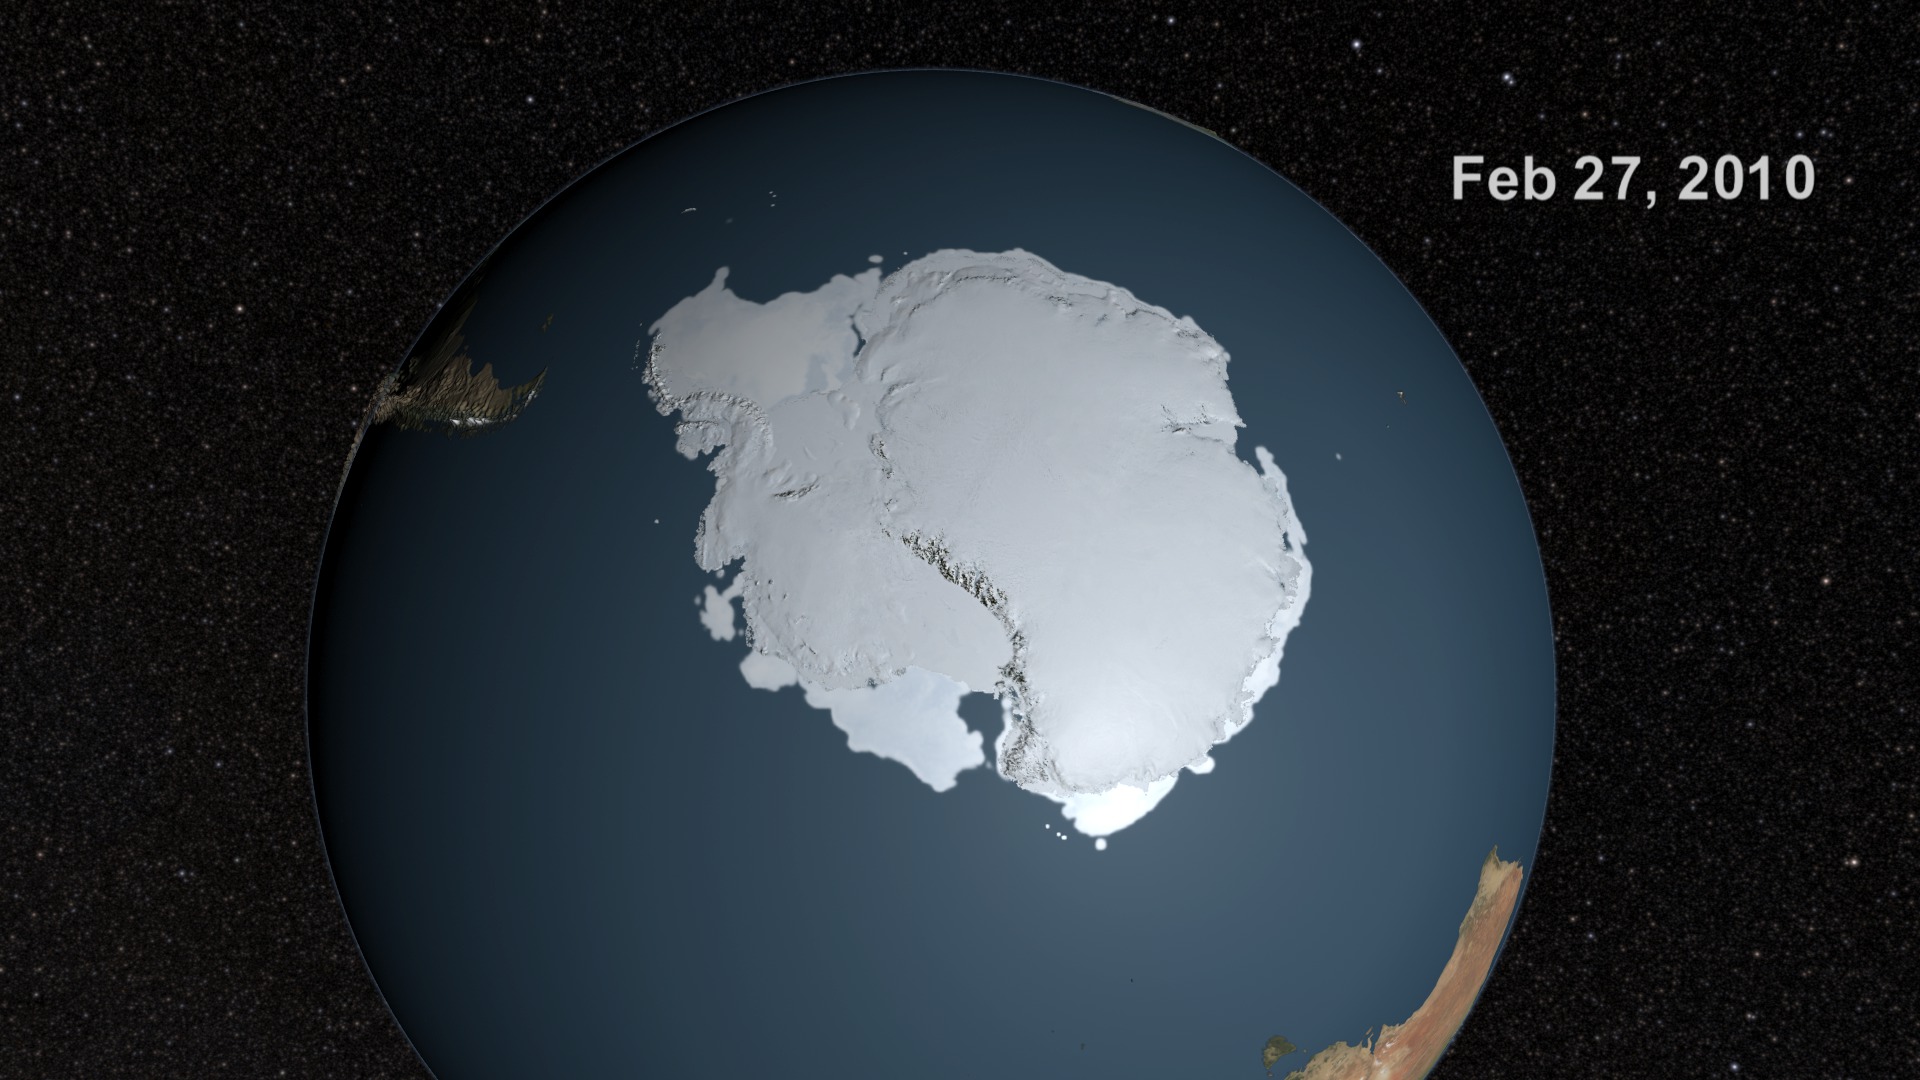
Above is an image of the Antarctic sea ice on October 6, 2015, the day on which it reached its annual maximum extent. The date is also displayed.
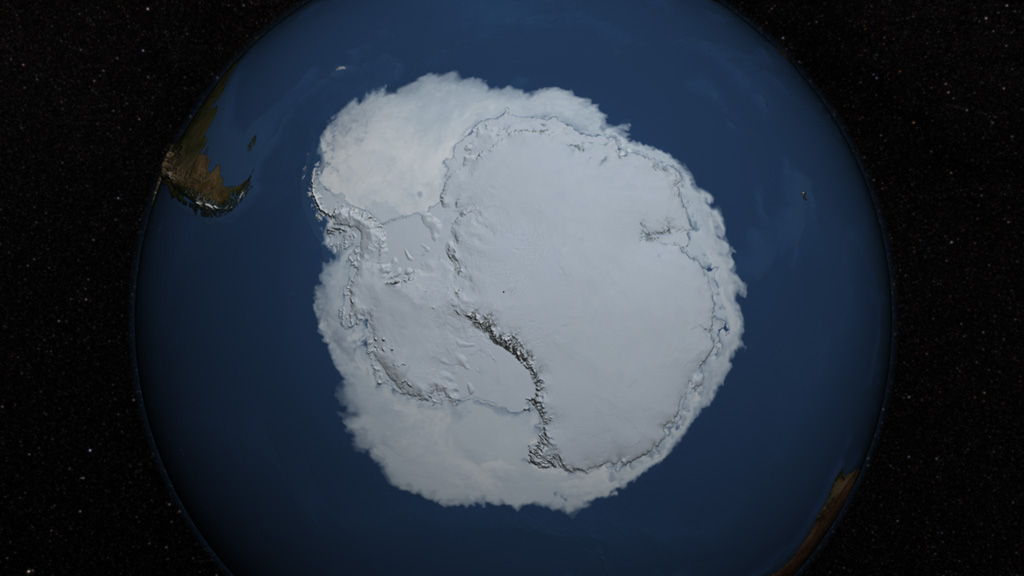
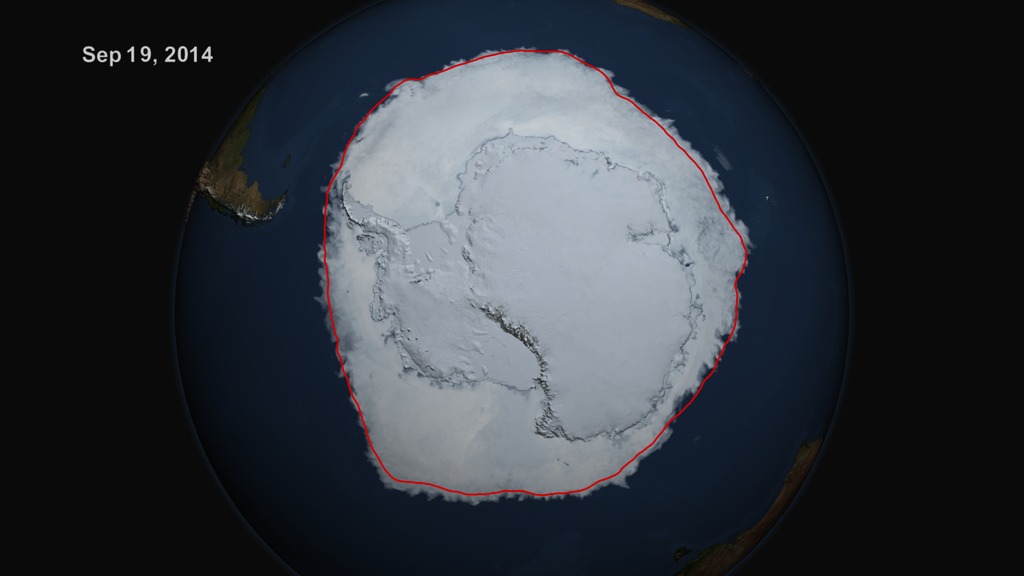
The Antarctic sea ice reached its annual maximum extent on October 6, 2015. The images shown here portray the sea ice as it was observed by the AMSR2 instrument onboard the Japanese Suzaku satellite. The opacity of the sea ice is derived from the AMSR2 sea ice concentration. The blueish white color of the sea ice is derived from the AMSR2 89 GHz brightness temperature. In some of the images, a thin red line demarks the average maximum sea ice extent from 1981 through 2010. The Landsat Image Mosaic of Antarctica is shown over the continent.
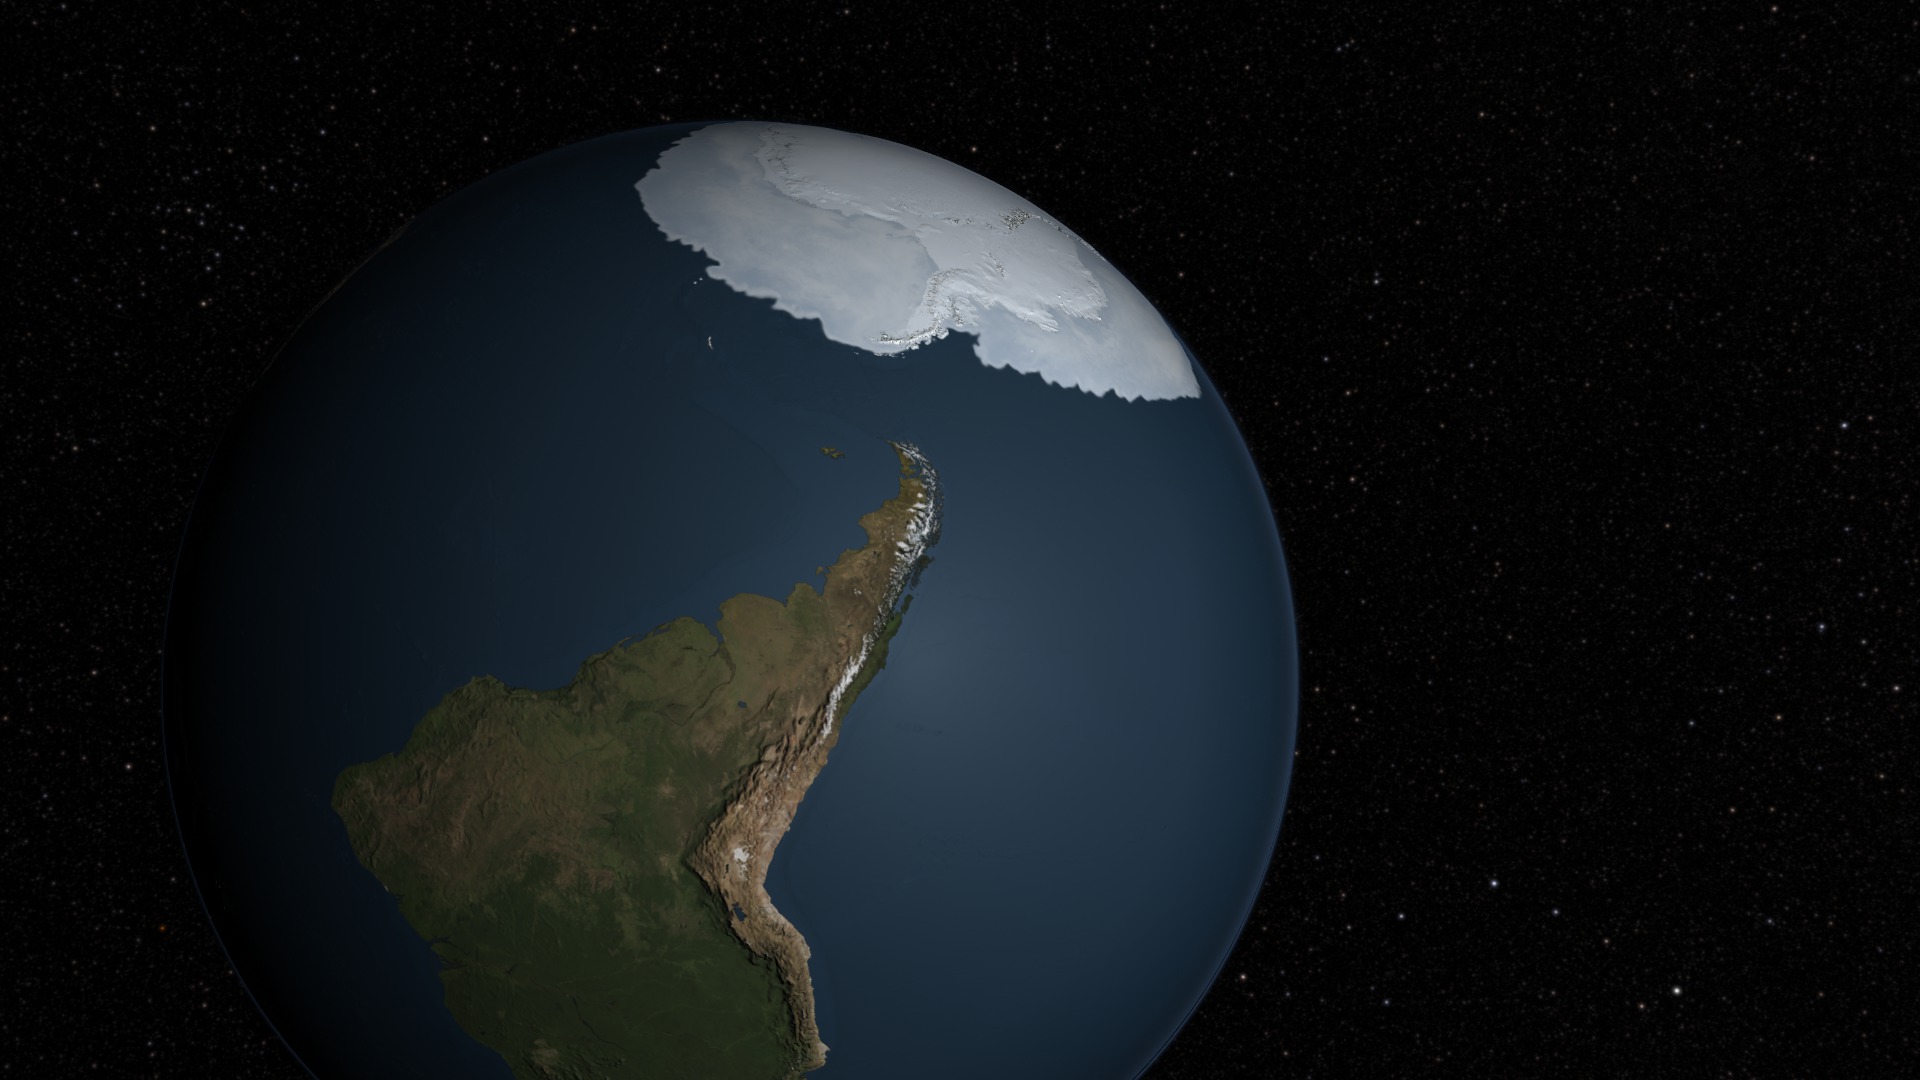
This visualization shows the growth of the Antarctic sea ice beginning on the day of its annual minimum extent, February 20, 2015, and running through the date of its annual maximum extent, October 6, 2015.
Above is an image of the Antarctic sea ice on October 6, 2015, the day on which it reached its maximum annual extent.
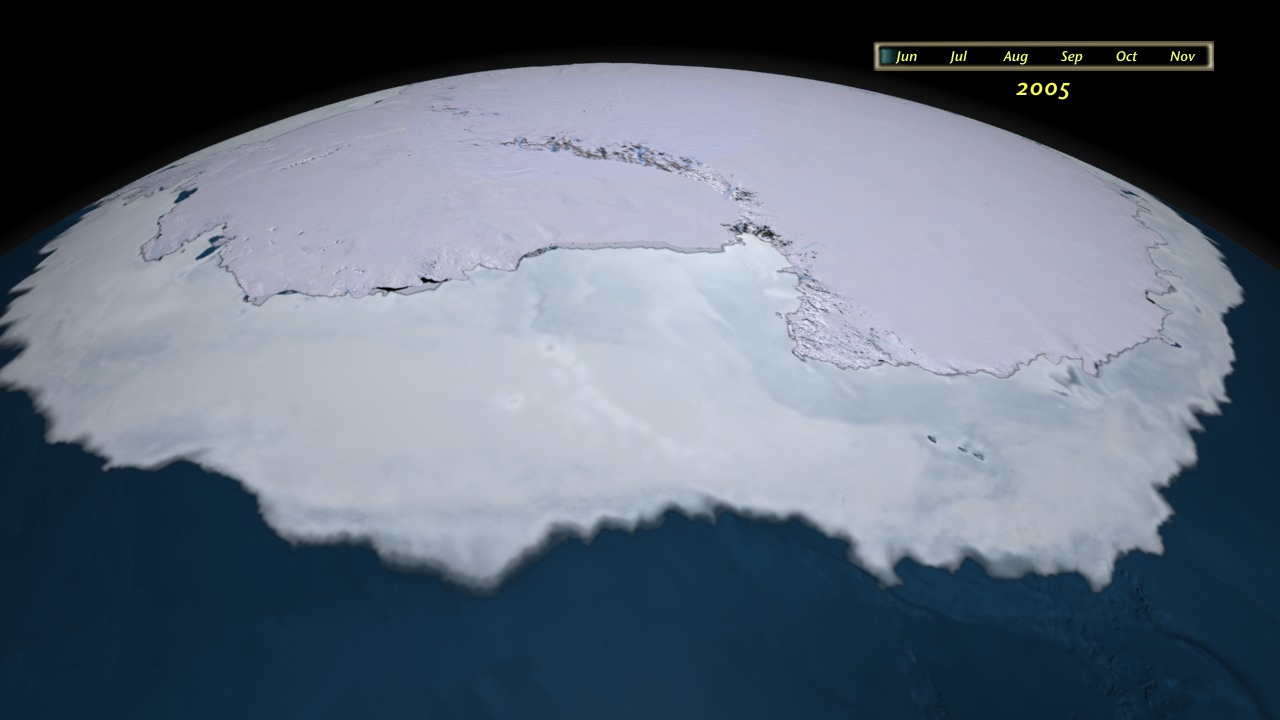
Above is an image of the Antarctic sea ice on October 6, 2015, the day on which it reached its maximum annual extent. The red line indicates the average annual maximum extent from 1981 through 2010. The date is also shown.
Above is an image of the Antarctic sea ice on October 6, 2015, the day on which it reached its maximum annual extent. The red line indicates the average maximum extent line from 1981 through 2010.
Credits
Please give credit for this item to:
NASA's Scientific Visualization Studio
-
Visualizers
- Cindy Starr (Global Science and Technology, Inc.)
- Lori Perkins (NASA/GSFC)
-
Scientists
- Walt Meier (NASA/GSFC)
- Josefino Comiso (NASA/GSFC)
-
Sr. data analyst
- Robert Gersten (Wyle Information Systems)
-
Writer
- Maria-Jose Vinas Garcia (Telophase)
-
Technical support
- Laurence Schuler (ADNET Systems, Inc.)
- Ian Jones (ADNET Systems, Inc.)
-
Project support
- Leann Johnson (Global Science and Technology, Inc.)
- Joycelyn Thomson Jones (NASA/GSFC)
- Eric Sokolowsky (Global Science and Technology, Inc.)
Release date
This page was originally published on Tuesday, October 20, 2015.
This page was last updated on Tuesday, November 14, 2023 at 12:06 AM EST.
Missions
This visualization is related to the following missions:Datasets used in this visualization
-
BMNG (Blue Marble: Next Generation) [Terra and Aqua: MODIS]
ID: 508Credit: The Blue Marble data is courtesy of Reto Stockli (NASA/GSFC).
This dataset can be found at: http://earthobservatory.nasa.gov/Newsroom/BlueMarble/
See all pages that use this dataset -
10 km Daily Sea Ice Concentration [SHIZUKU (GCOM-W1): AMSR2]
ID: 795Credit: AMSR2 data courtesy of the Japan Aerospace Exploration Agency (JAXA).
See all pages that use this dataset -
10 km Daily 89 GHz Brightness Temperature [SHIZUKU (GCOM-W1): AMSR2]
ID: 796Credit: AMSR2 data courtesy of the Japan Aerospace Exploration Agency (JAXA).
See all pages that use this dataset
Note: While we identify the data sets used in these visualizations, we do not store any further details, nor the data sets themselves on our site.
Related
- ID: 12032
 Produced Video
 - ID: 3854
 Visualization
 - ID: 3862
 Visualization
 - ID: 3497
 Visualization
Older Versions
- ID: 4219
 Visualization