Earth
ID: 4219
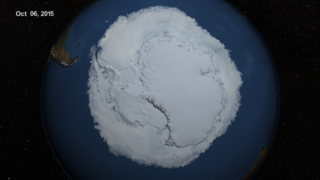
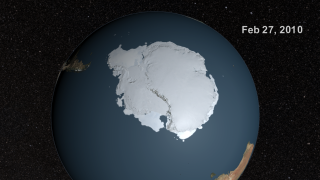
In this animation we see the Antarctic sea ice expansion from March, 21, 2014 through September 19, 2014, the date on which the sea ice reached its maximum annual extent. Over the water, the opacity of the sea ice is determined by a running 3-day maximum of the AMSR2 sea ice concentration. The blueish white color of the sea ice is a false color derived from a 3-day running minimum of the AMSR2 89 GHz brightness temperature. Over the Antarctic continent, the LIMA data shown here uses the pan-chromatic band and has a resolution of 240 meters per pixel.
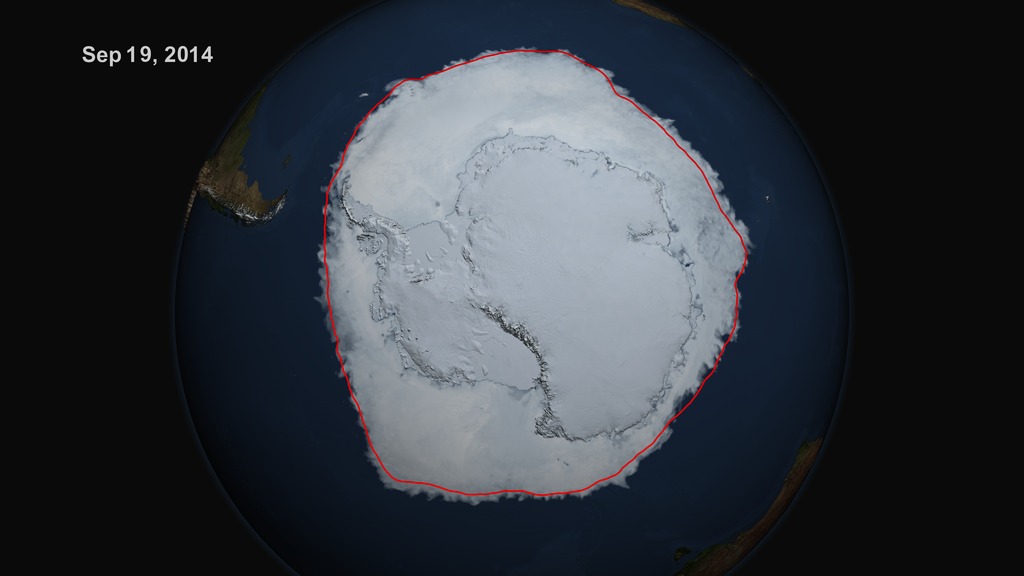
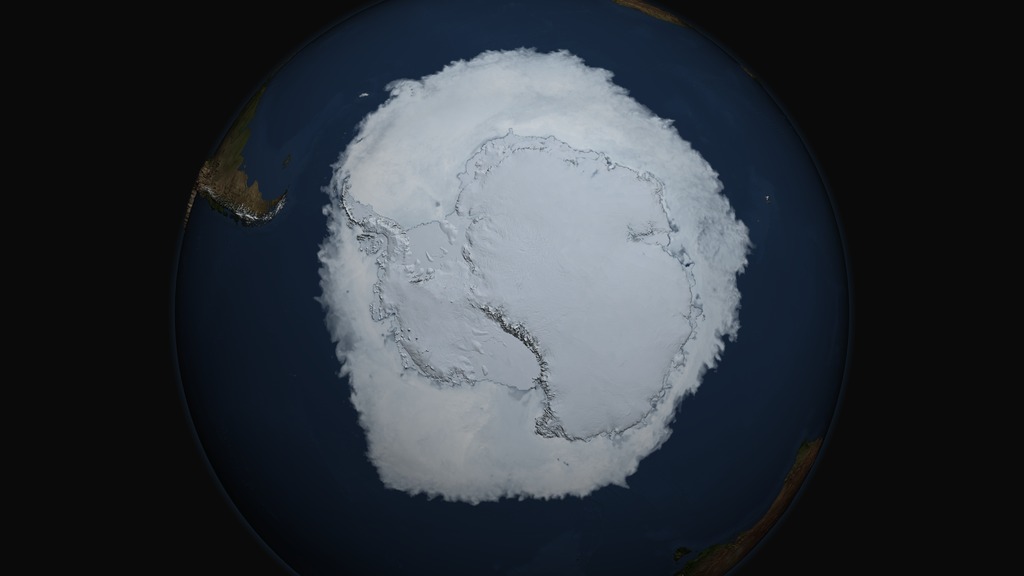
Maximum Antarctic Sea Ice 2014
There is a newer version of this story located here: https://svs.gsfc.nasa.gov/4562
Newer Versions
Related
Visualization Credits
Cindy Starr (Global Science and Technology, Inc.): Lead Visualizer
Joy Ng (USRA): Producer
Josefino Comiso (NASA/GSFC): Scientist
Robert Gersten (Wyle Information Systems): Scientist
Laurence Schuler (ADNET Systems, Inc.): Project Support
Ian Jones (ADNET Systems, Inc.): Project Support
Joy Ng (USRA): Producer
Josefino Comiso (NASA/GSFC): Scientist
Robert Gersten (Wyle Information Systems): Scientist
Laurence Schuler (ADNET Systems, Inc.): Project Support
Ian Jones (ADNET Systems, Inc.): Project Support
Please give credit for this item to:
NASA's Scientific Visualization Studio
NASA's Scientific Visualization Studio
Short URL to share this page:
https://svs.gsfc.nasa.gov/4219
Mission:
Terra
Data Used:
Note: While we identify the data sets used in these visualizations, we do not store any further details nor the data sets themselves on our site.
Keywords:
DLESE >> Cryology
SVS >> HDTV
DLESE >> Physical oceanography
GCMD >> Earth Science >> Cryosphere >> Sea Ice
GCMD >> Earth Science >> Oceans >> Sea Ice
GCMD >> Earth Science >> Cryosphere >> Sea Ice >> Sea Ice Concentration
GCMD >> Earth Science >> Oceans >> Sea Ice >> Sea Ice Concentration
GCMD >> Earth Science >> Oceans >> Sea Ice >> Sea Ice Motion
NASA Science >> Earth
GCMD >> Earth Science >> Climate Indicators >> Cryospheric Indicators >> Sea Ice Concentration
GCMD keywords can be found on the Internet with the following citation: Olsen, L.M., G. Major, K. Shein, J. Scialdone, S. Ritz, T. Stevens, M. Morahan, A. Aleman, R. Vogel, S. Leicester, H. Weir, M. Meaux, S. Grebas, C.Solomon, M. Holland, T. Northcutt, R. A. Restrepo, R. Bilodeau, 2013. NASA/Global Change Master Directory (GCMD) Earth Science Keywords. Version 8.0.0.0.0
https://svs.gsfc.nasa.gov/4219
Mission:
Terra
Data Used:
Terra and Aqua/MODIS/Blue Marble: Next Generation also referred to as: BMNG
Credit:
The Blue Marble data is courtesy of Reto Stockli (NASA/GSFC).
The Blue Marble data is courtesy of Reto Stockli (NASA/GSFC).
SHIZUKU (GCOM-W1)/AMSR2/10 km Daily Sea Ice Concentration
Observed Data - Japan Aerospace Exploration Agency - 02/21/2014 to 09/19/2014
Credit:
AMSR2 data courtesy of the Japan Aerospace Exploration Agency (JAXA).
AMSR2 data courtesy of the Japan Aerospace Exploration Agency (JAXA).
SHIZUKU (GCOM-W1)/AMSR2/10 km Daily 89 GHz Brightness Temperature
Observed Data - Japan Aerospace Exploration Agency - 02/21/2014 to 09/19/2014
Credit:
AMSR2 data courtesy of the Japan Aerospace Exploration Agency (JAXA).
AMSR2 data courtesy of the Japan Aerospace Exploration Agency (JAXA).
Keywords:
DLESE >> Cryology
SVS >> HDTV
DLESE >> Physical oceanography
GCMD >> Earth Science >> Cryosphere >> Sea Ice
GCMD >> Earth Science >> Oceans >> Sea Ice
GCMD >> Earth Science >> Cryosphere >> Sea Ice >> Sea Ice Concentration
GCMD >> Earth Science >> Oceans >> Sea Ice >> Sea Ice Concentration
GCMD >> Earth Science >> Oceans >> Sea Ice >> Sea Ice Motion
NASA Science >> Earth
GCMD >> Earth Science >> Climate Indicators >> Cryospheric Indicators >> Sea Ice Concentration
GCMD keywords can be found on the Internet with the following citation: Olsen, L.M., G. Major, K. Shein, J. Scialdone, S. Ritz, T. Stevens, M. Morahan, A. Aleman, R. Vogel, S. Leicester, H. Weir, M. Meaux, S. Grebas, C.Solomon, M. Holland, T. Northcutt, R. A. Restrepo, R. Bilodeau, 2013. NASA/Global Change Master Directory (GCMD) Earth Science Keywords. Version 8.0.0.0.0


