National Climate Assessment Annual Arctic Minimum Sea Ice Extents (1979-2012)
There is a newer version of this story located here: https://svs.gsfc.nasa.gov/4435
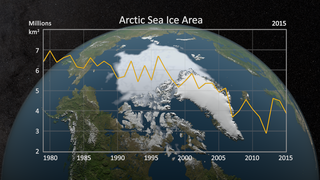
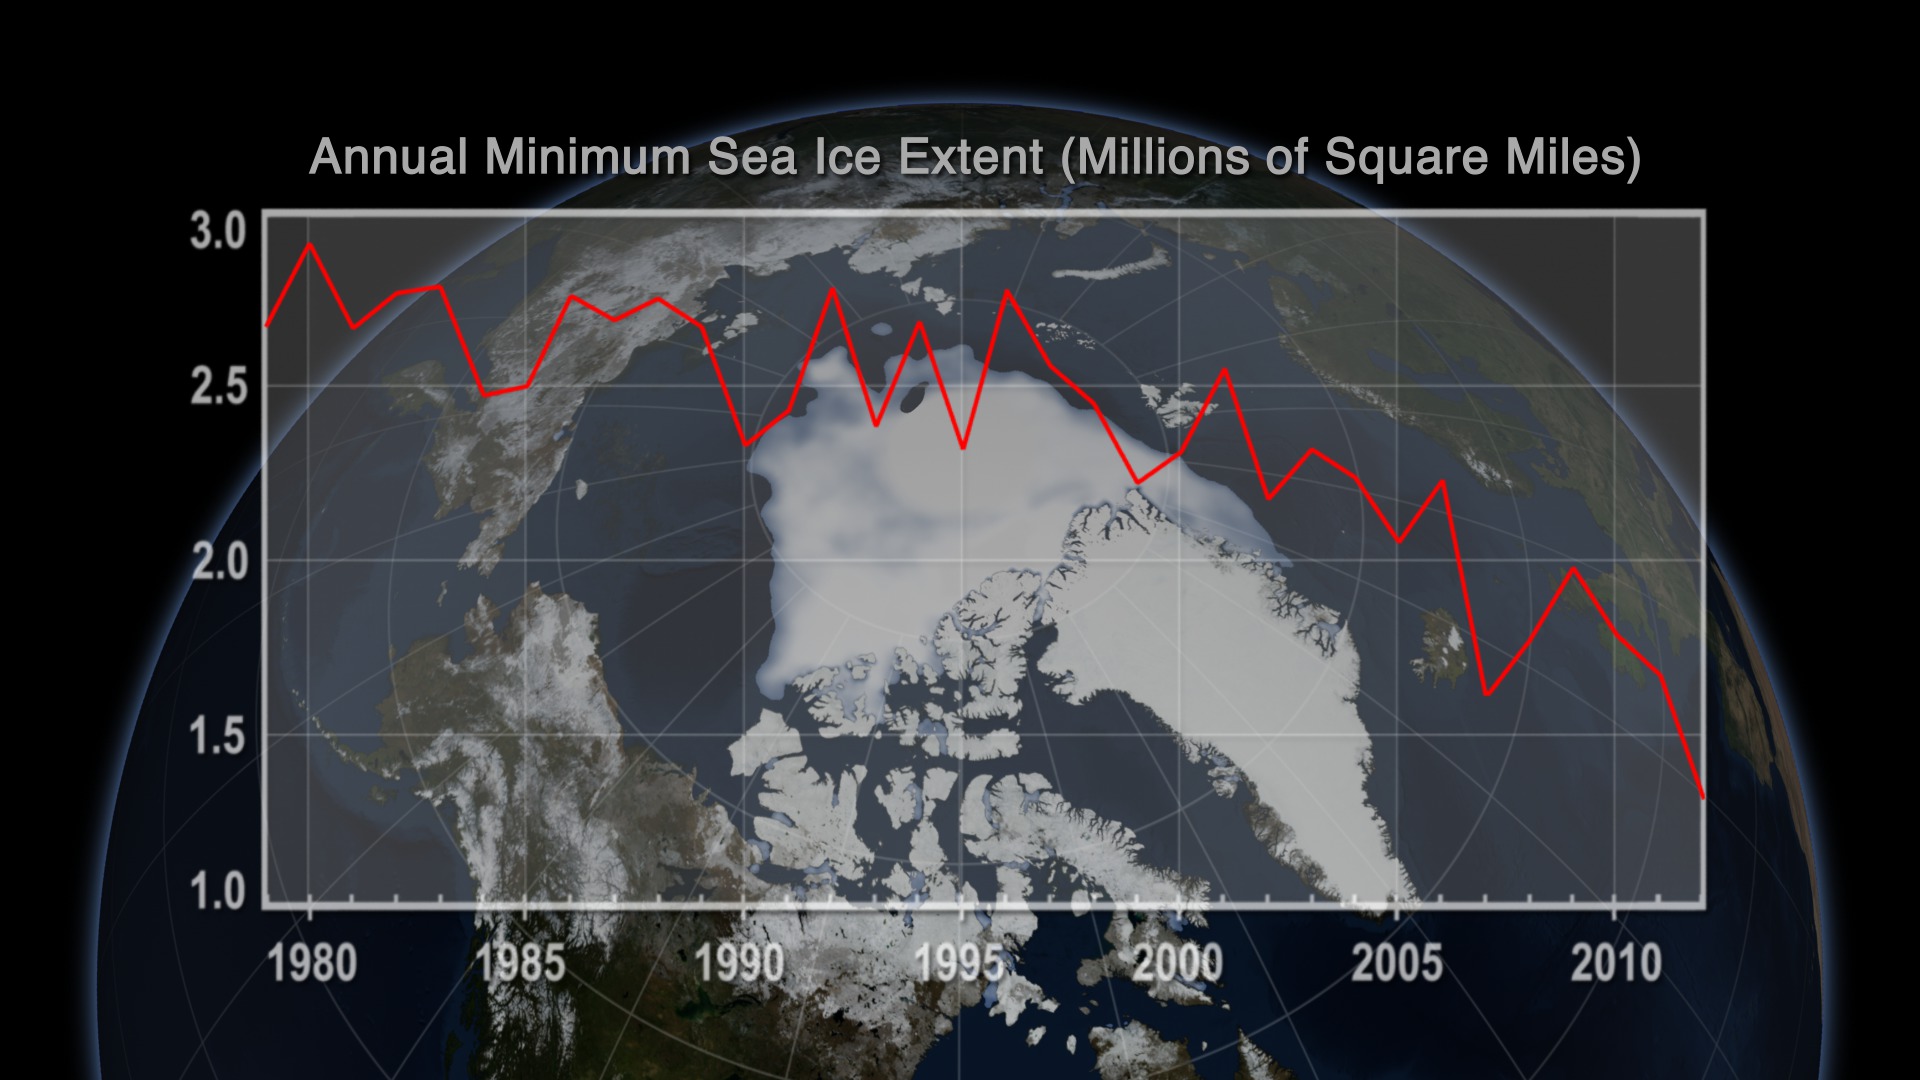
This scientific visualization of annual minimum sea ice area over the Arctic from 1979-2012 is one element of the NCA that highlights findings conveyed in the "Our Changing Climate", the "Alaska and the Arctic" and the "Impacts of Climate Change on Tribal, Indigenous, and Native Lands and Resources" chapters of the draft Third NCA report. This record shows a persistent decline in the minimum extent of Arctic sea ice cover. The satellite observations are from passive microwave sensors and processed using the NASA Team algorithm developed by scientists at NASA Goddard Space Flight Center. The sensors that collected the data are the Scanning Multichannel Microwave Radiometer (SMMR) on the NASA Nimbus-7 satellite and a series of Special Sensor Microwave Imagers (SSM/I) and Special Sensor Microwave Imager and Sounders (SSMIS) on U.S. Department of Defense Meteorological Satellite Program (DMSP) satellites. The data from the different sensors are carefully assembled to assure consistency throughout the 34 year record.
This visualization is similar to another developed by NASA, but is based on a slightly different algorithm to process the same sensor data. Both show similar downward trends in minimum sea ice area coverage over this time period.


Newer Version
Visualization Credits
Cindy Starr (Global Science and Technology, Inc.): Visualizer
Greg Shirah (NASA/GSFC): Animator
Alex Kekesi (Global Science and Technology, Inc.): Video Editor
Allison Leidner (USRA): Producer
Walt Meier (NSIDC): Scientist
Mark C. Serreze (NSIDC): Scientist
Ted Scambos (NSIDC): Scientist
Julienne Stroeve (NSIDC): Scientist
Don Cavalieri (NASA): Scientist
Claire Parkinson (NASA/GSFC): Scientist
Brooke Stewart (NOAA/NCDC,CICS-NC): Project Support
Matt Savoie (NSIDC): Project Support
NASA/Goddard Space Flight Center Scientific Visualization Studio
NSIDC
NOAA
https://svs.gsfc.nasa.gov/4004
Data Used:
Sea Ice Concentrations from Nimbus-7 SMMR and DMSP SSM/I-SSMIS Passive Microwave Data
Data Compilation - NSIDCThis item is part of this series:
National Climate Assessment
Keywords:
DLESE >> Cryology
SVS >> HDTV
DLESE >> Physical oceanography
GCMD >> Earth Science >> Oceans >> Sea Ice
GCMD >> Earth Science >> Climate Indicators >> Teleconnections >> Arctic Oscillation
GCMD >> Location >> Arctic
SVS >> Hyperwall
NASA Science >> Earth
GCMD keywords can be found on the Internet with the following citation: Olsen, L.M., G. Major, K. Shein, J. Scialdone, S. Ritz, T. Stevens, M. Morahan, A. Aleman, R. Vogel, S. Leicester, H. Weir, M. Meaux, S. Grebas, C.Solomon, M. Holland, T. Northcutt, R. A. Restrepo, R. Bilodeau, 2013. NASA/Global Change Master Directory (GCMD) Earth Science Keywords. Version 8.0.0.0.0


