A newer version of this visualization is available.
September Arctic Minimum Arctic Sea Ice 2012
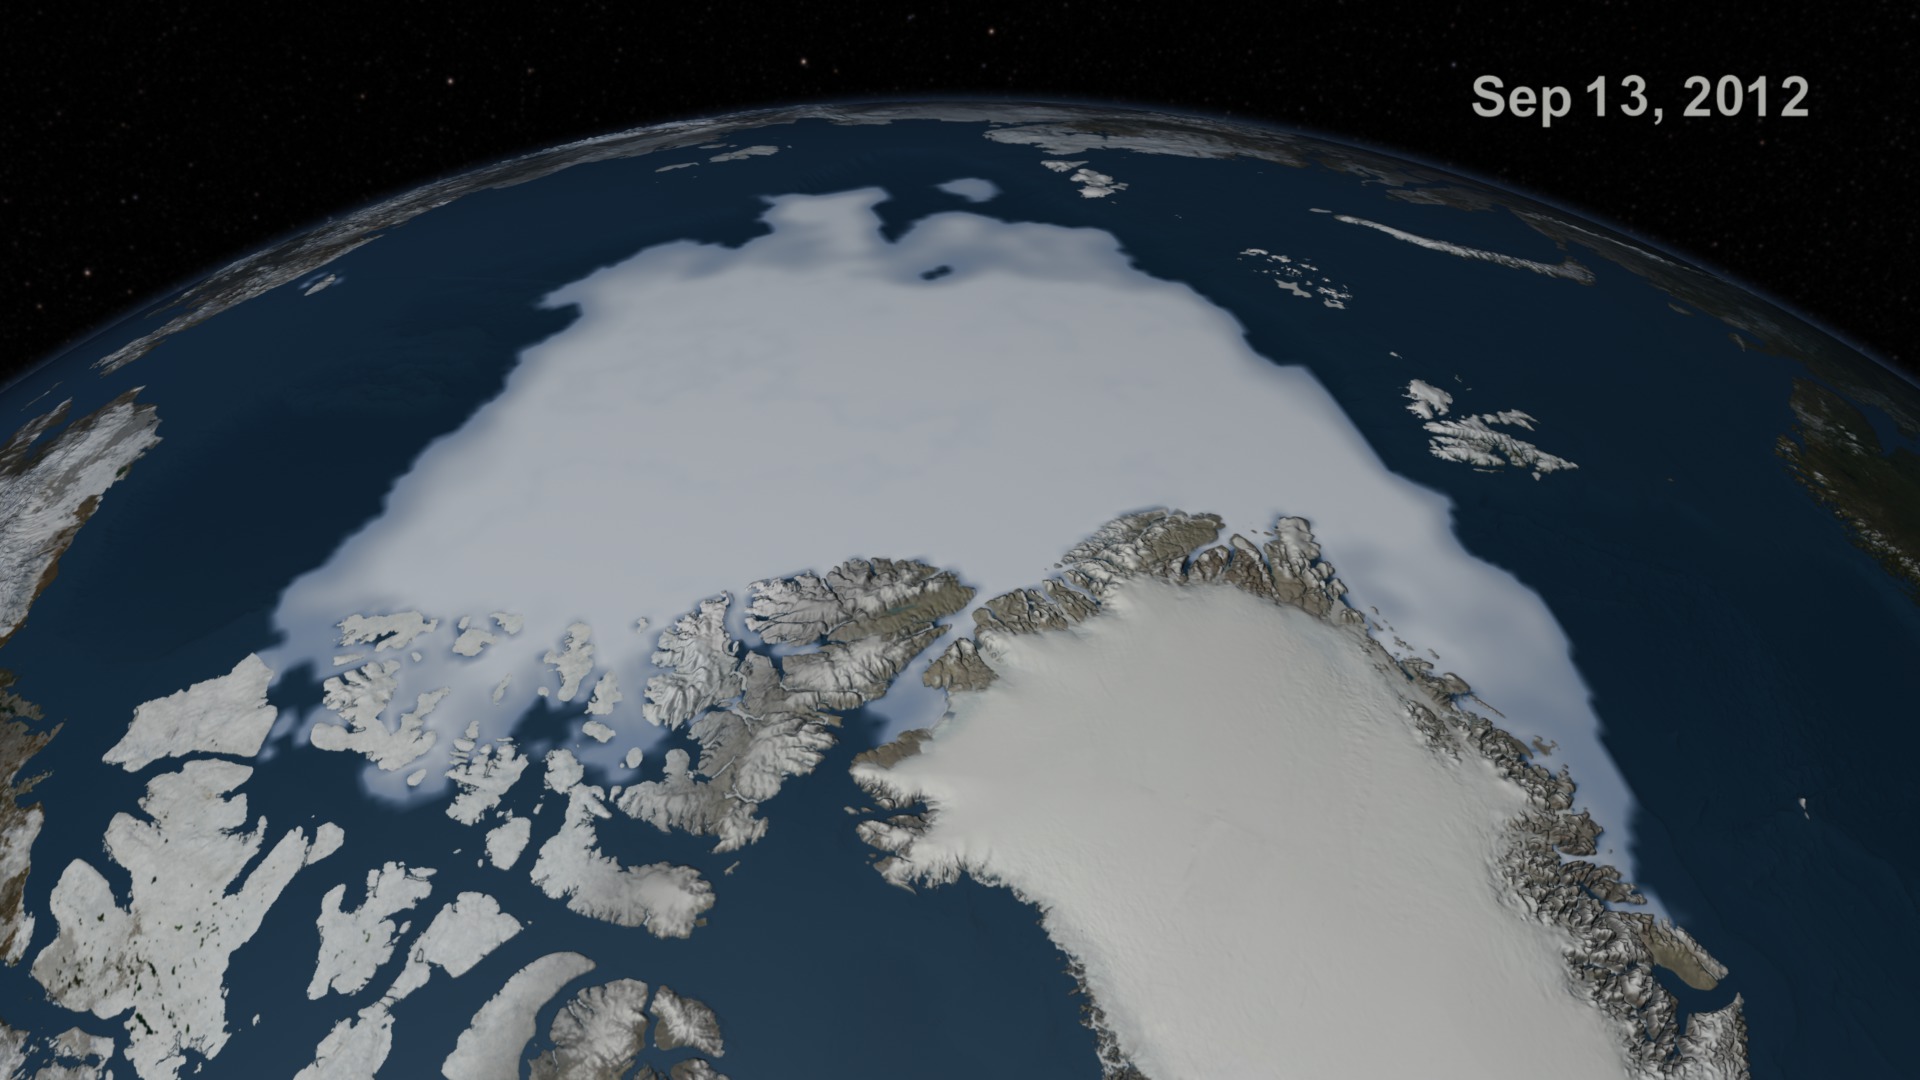
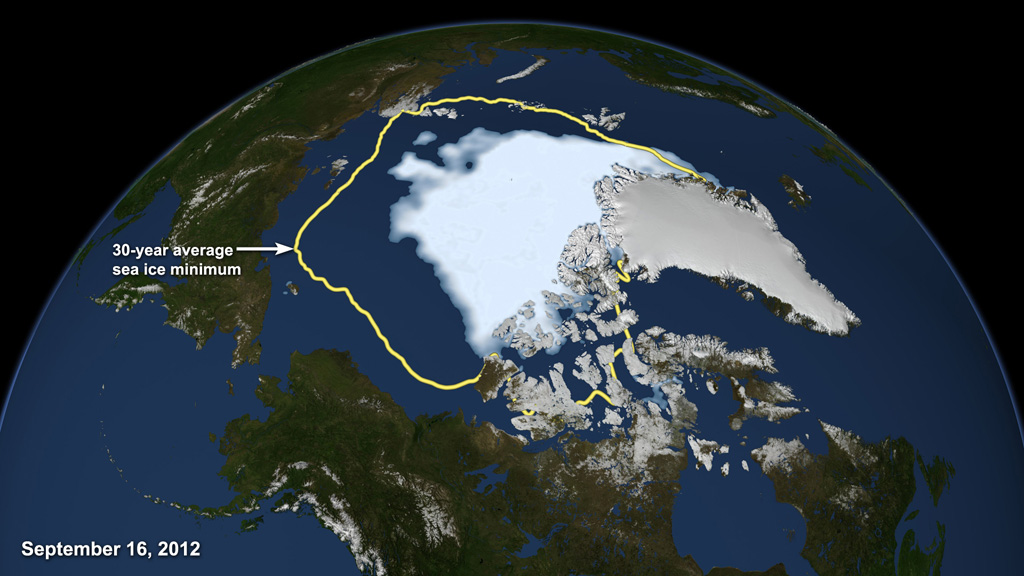
These images show the Arctic sea ice in September 2012 when it reached the smallest extent ever recorded in more than three decades of satellite measurements, according to scientists from NASA and the National Snow and Ice Data Center(NSIDC). Scientists at the NSIDC who calculate the sea ice minimum based on a 5-day trailing average identified September 16 as the lowest day. NASA scientists who calculate area on each individual day identified September 13th, although there is little difference between the two days. The data is from the U.S. Defense Meteorological Satellite Program's Special Sensor Microwave/Imager. The line on the image shows the average minimum extent from the period covering 1979-2010, as measured by satellites. Every summer the Arctic ice cap melts down to what scientists call its "minimum" before colder weather builds the ice cover back up. This year, according to NASA scientists, the area covered 3.439 million square kilometers, down by more than 3.571 million square kilometers from the high of 7.011 million square kilometers measured in 1980. The size of this minimum remains in a long-term decline.
The sea ice has a slightly different coloration in the last three groups of images below. In the first four groups, the color of the sea ice has a pale blue tint. In the final three groups, the sea ice is shown in white.

An image of the Arctic sea ice on September 16, 2012, the day that the National Snow and Ice Data Center identified to be the minimum reached in 2012. The yellow outline shows the average sea ice minimum from 1979 through 2010. The sea ice is shown with a blue tint.
An image of the Arctic sea ice on September 16, 2012, the day that the National Snow and Ice Data Center identified to be the minimum reached in 2012. The sea ice is shown with a blue tint.
An image of the Arctic sea ice on September 13, 2012, the day that NASA scientists identified to be the minimum area in 2012. The yellow outline shows the average sea ice minimum from 1979 through 2010. The sea ice is shown with a blue tint.
An image of the Arctic sea ice on September 13, 2012, the day that NASA scientists identified to be the minimum area in 2012. The sea ice is shown with a blue tint. The sea ice is shown with a blue tint.
An image of the Arctic sea ice on September 16, 2012, the day that the National Snow and Ice Data Center identified to be the minimum reached in 2012. The sea ice is shown colored white. The sea ice is shown here in white.
An image of the Arctic sea ice on September 13, 2012, the day that NASA scientists identified to be the minimum area in 2012. The sea ice is shown here in white.
An image of the Arctic sea ice on September 21, 1979, the day that NASA scientists identified as the minimum area in 1979 and is shown here for the purpose of comparison. The sea ice is shown here in white.
Credits
Please give credit for this item to:
NASA/Goddard Space Flight Center Scientific Visualization Studio
The Blue Marble data is courtesy of Reto Stockli (NASA/GSFC).
-
Visualizer
- Cindy Starr (Global Science and Technology, Inc.)
-
Animators
- Greg Shirah (NASA/GSFC)
- Lori Perkins (NASA/GSFC)
-
Producers
- Jefferson Beck (USRA)
- Patrick Lynch (Wyle Information Systems)
-
Scientists
- Josefino Comiso (NASA/GSFC)
- Robert Gersten (RSIS)
- Robert Gersten (Wyle Information Systems)
-
Project support
- Laurence Schuler (ADNET Systems, Inc.)
- Ian Jones (ADNET Systems, Inc.)
Release date
This page was originally published on Wednesday, September 19, 2012.
This page was last updated on Wednesday, May 3, 2023 at 1:52 PM EDT.
Datasets used in this visualization
-
[DMSP: SSM/I]
ID: 11Defense Meteorological Satellite Program Special Sensor Microwave Imager
See all pages that use this dataset -
Comiso's September Minimum Sea Ice Concentration
ID: 540 -
Average Sea Ice Minimum (Comiso's Average Sea Ice Minimum from 1979 through 2010) [DMSP: SSMI]
ID: 756
Note: While we identify the data sets used in these visualizations, we do not store any further details, nor the data sets themselves on our site.
Related
- ID: 11081
 Produced Video
Newer Versions
- ID: 4052