Earth
ID: 3367
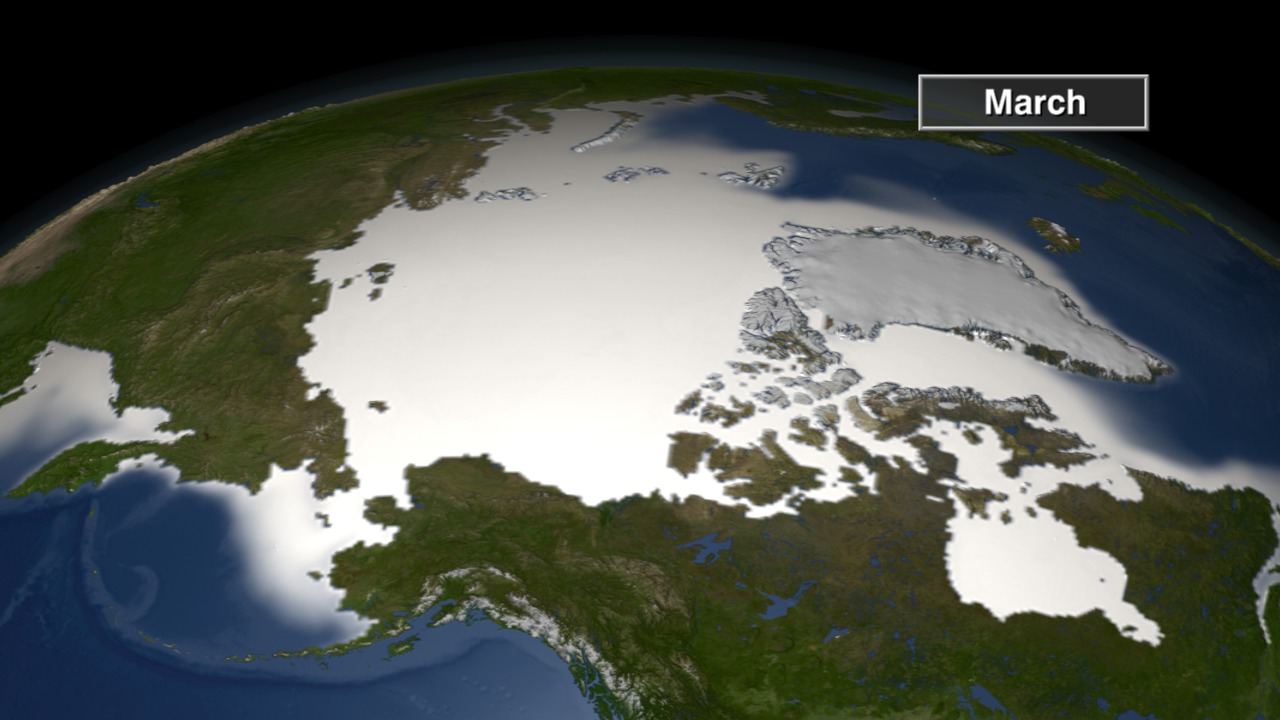
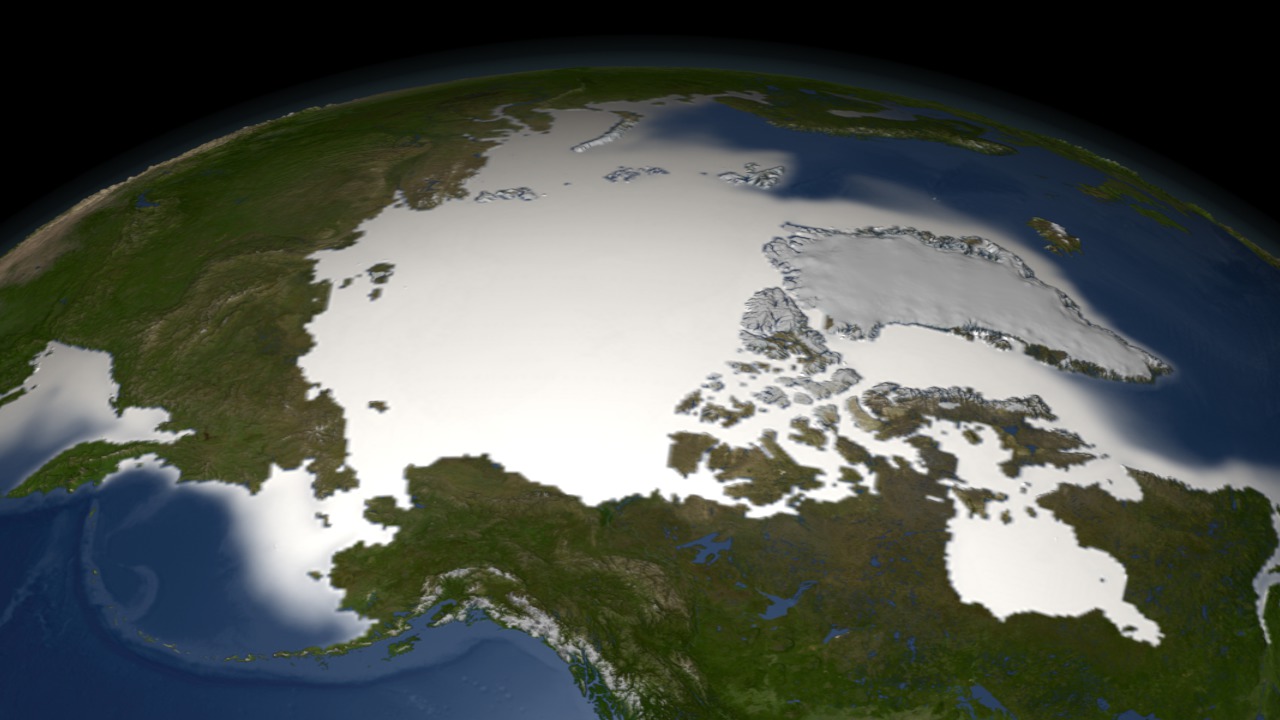
Sea ice advances and retreats in concert with the seasons. Monthly sea ice climatology is created by averaging the sea ice for each month over a period of many years. This animation shows the monthly average sea ice climatology over the Arctic region derived from years 1979 through 2002.
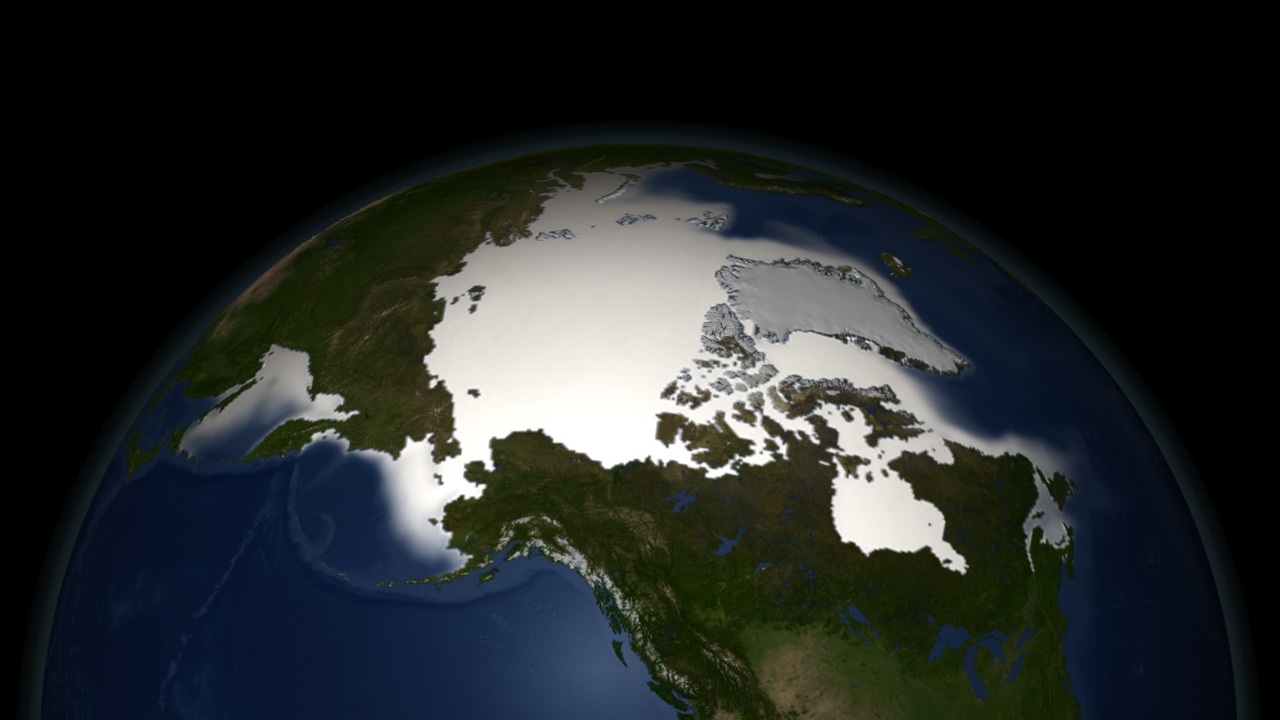
Arctic Monthly Average Sea Ice Climatology
Visualization Credits
Cindy Starr (Global Science and Technology, Inc.): Lead Visualizer
Stuart A. Snodgrass (GST): Animator
Waleed Abdalati (NASA/HQ): Scientist
Walt Meier (NSIDC): Scientist
Stuart A. Snodgrass (GST): Animator
Waleed Abdalati (NASA/HQ): Scientist
Walt Meier (NSIDC): Scientist
Please give credit for this item to:
NASA/Goddard Space Flight Center Scientific Visualization Studio The Blue Marble data is courtesy of Reto Stockli (NASA/GSFC).
NASA/Goddard Space Flight Center Scientific Visualization Studio The Blue Marble data is courtesy of Reto Stockli (NASA/GSFC).
Short URL to share this page:
https://svs.gsfc.nasa.gov/3367
Data Used:
Note: While we identify the data sets used in these visualizations, we do not store any further details nor the data sets themselves on our site.
This item is part of this series:
NASM2006
Goddard TV Tape:
G2007-001HD -- NASA's HD Climate Change Resource Tape
Keywords:
DLESE >> Climatology
DLESE >> Cryology
SVS >> HDTV
GCMD >> Earth Science >> Cryosphere
GCMD >> Earth Science >> Cryosphere >> Sea Ice
GCMD >> Earth Science >> Cryosphere >> Snow/Ice
GCMD >> Earth Science >> Hydrosphere >> Snow/Ice
GCMD >> Earth Science >> Cryosphere >> Sea Ice >> Ice Growth/Melt
GCMD >> Earth Science >> Cryosphere >> Sea Ice >> Sea Ice Concentration
GCMD >> Earth Science >> Cryosphere >> Sea Ice >> Sea Ice Motion
GCMD >> Earth Science >> Cryosphere >> Snow/Ice >> Ice Growth/Melt
GCMD >> Earth Science >> Cryosphere >> Snow/Ice >> Ice Motion
GCMD >> Earth Science >> Hydrosphere >> Snow/Ice >> Ice Motion
GCMD >> Earth Science >> Oceans >> Sea Ice >> Ice Growth/Melt
GCMD >> Location >> Arctic
NASA Science >> Earth
GCMD keywords can be found on the Internet with the following citation: Olsen, L.M., G. Major, K. Shein, J. Scialdone, S. Ritz, T. Stevens, M. Morahan, A. Aleman, R. Vogel, S. Leicester, H. Weir, M. Meaux, S. Grebas, C.Solomon, M. Holland, T. Northcutt, R. A. Restrepo, R. Bilodeau, 2013. NASA/Global Change Master Directory (GCMD) Earth Science Keywords. Version 8.0.0.0.0
https://svs.gsfc.nasa.gov/3367
Data Used:
DMSP/SSM/I
1979-2002
Defense Meteorological Satellite Program Special Sensor Microwave Imager
NOAA/AVHRR/NDVI
1979-2002This item is part of this series:
NASM2006
Goddard TV Tape:
G2007-001HD -- NASA's HD Climate Change Resource Tape
Keywords:
DLESE >> Climatology
DLESE >> Cryology
SVS >> HDTV
GCMD >> Earth Science >> Cryosphere
GCMD >> Earth Science >> Cryosphere >> Sea Ice
GCMD >> Earth Science >> Cryosphere >> Snow/Ice
GCMD >> Earth Science >> Hydrosphere >> Snow/Ice
GCMD >> Earth Science >> Cryosphere >> Sea Ice >> Ice Growth/Melt
GCMD >> Earth Science >> Cryosphere >> Sea Ice >> Sea Ice Concentration
GCMD >> Earth Science >> Cryosphere >> Sea Ice >> Sea Ice Motion
GCMD >> Earth Science >> Cryosphere >> Snow/Ice >> Ice Growth/Melt
GCMD >> Earth Science >> Cryosphere >> Snow/Ice >> Ice Motion
GCMD >> Earth Science >> Hydrosphere >> Snow/Ice >> Ice Motion
GCMD >> Earth Science >> Oceans >> Sea Ice >> Ice Growth/Melt
GCMD >> Location >> Arctic
NASA Science >> Earth
GCMD keywords can be found on the Internet with the following citation: Olsen, L.M., G. Major, K. Shein, J. Scialdone, S. Ritz, T. Stevens, M. Morahan, A. Aleman, R. Vogel, S. Leicester, H. Weir, M. Meaux, S. Grebas, C.Solomon, M. Holland, T. Northcutt, R. A. Restrepo, R. Bilodeau, 2013. NASA/Global Change Master Directory (GCMD) Earth Science Keywords. Version 8.0.0.0.0


