Earth
ID: 3361
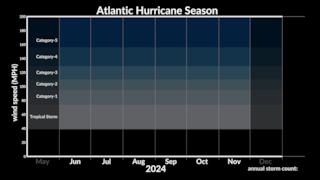
These still images shows plots of time vs. wind speed for each tropical storm/hurricane of the Atlantic Hurricane seasons. Horizontal lines indicate wind speed category thresholds. A line plot for each storm shows the storm's name and a marker at the peak wind speed.


Atlantic Hurricane/Storm Summary
There is a newer version of this story located here: https://svs.gsfc.nasa.gov/5072
The plot for the current year automatically updates every 2 hours during hurricane season.
Newer Version
Visualization Credits
Greg Shirah (NASA/GSFC): Lead Animator
Please give credit for this item to:
NASA/Goddard Space Flight Center Scientific Visualization Studio Storm wind speeds provided by NOAA's National Weather Service via UNISYS
NASA/Goddard Space Flight Center Scientific Visualization Studio Storm wind speeds provided by NOAA's National Weather Service via UNISYS
Short URL to share this page:
https://svs.gsfc.nasa.gov/3361
Data Used:
Note: While we identify the data sets used in these visualizations, we do not store any further details nor the data sets themselves on our site.
This item is part of this series:
Updates Regularly
Keywords:
DLESE >> Atmospheric science
DLESE >> Natural hazards
GCMD >> Earth Science >> Atmosphere >> Atmospheric Phenomena >> Hurricanes
NASA Science >> Earth
GCMD keywords can be found on the Internet with the following citation: Olsen, L.M., G. Major, K. Shein, J. Scialdone, S. Ritz, T. Stevens, M. Morahan, A. Aleman, R. Vogel, S. Leicester, H. Weir, M. Meaux, S. Grebas, C.Solomon, M. Holland, T. Northcutt, R. A. Restrepo, R. Bilodeau, 2013. NASA/Global Change Master Directory (GCMD) Earth Science Keywords. Version 8.0.0.0.0
https://svs.gsfc.nasa.gov/3361
Data Used:
Hurricane/Tropical Data
Database - Unisys - 06/01/2006 through present (or end of last hurricane season)This item is part of this series:
Updates Regularly
Keywords:
DLESE >> Atmospheric science
DLESE >> Natural hazards
GCMD >> Earth Science >> Atmosphere >> Atmospheric Phenomena >> Hurricanes
NASA Science >> Earth
GCMD keywords can be found on the Internet with the following citation: Olsen, L.M., G. Major, K. Shein, J. Scialdone, S. Ritz, T. Stevens, M. Morahan, A. Aleman, R. Vogel, S. Leicester, H. Weir, M. Meaux, S. Grebas, C.Solomon, M. Holland, T. Northcutt, R. A. Restrepo, R. Bilodeau, 2013. NASA/Global Change Master Directory (GCMD) Earth Science Keywords. Version 8.0.0.0.0


