Earth
ID: 2912
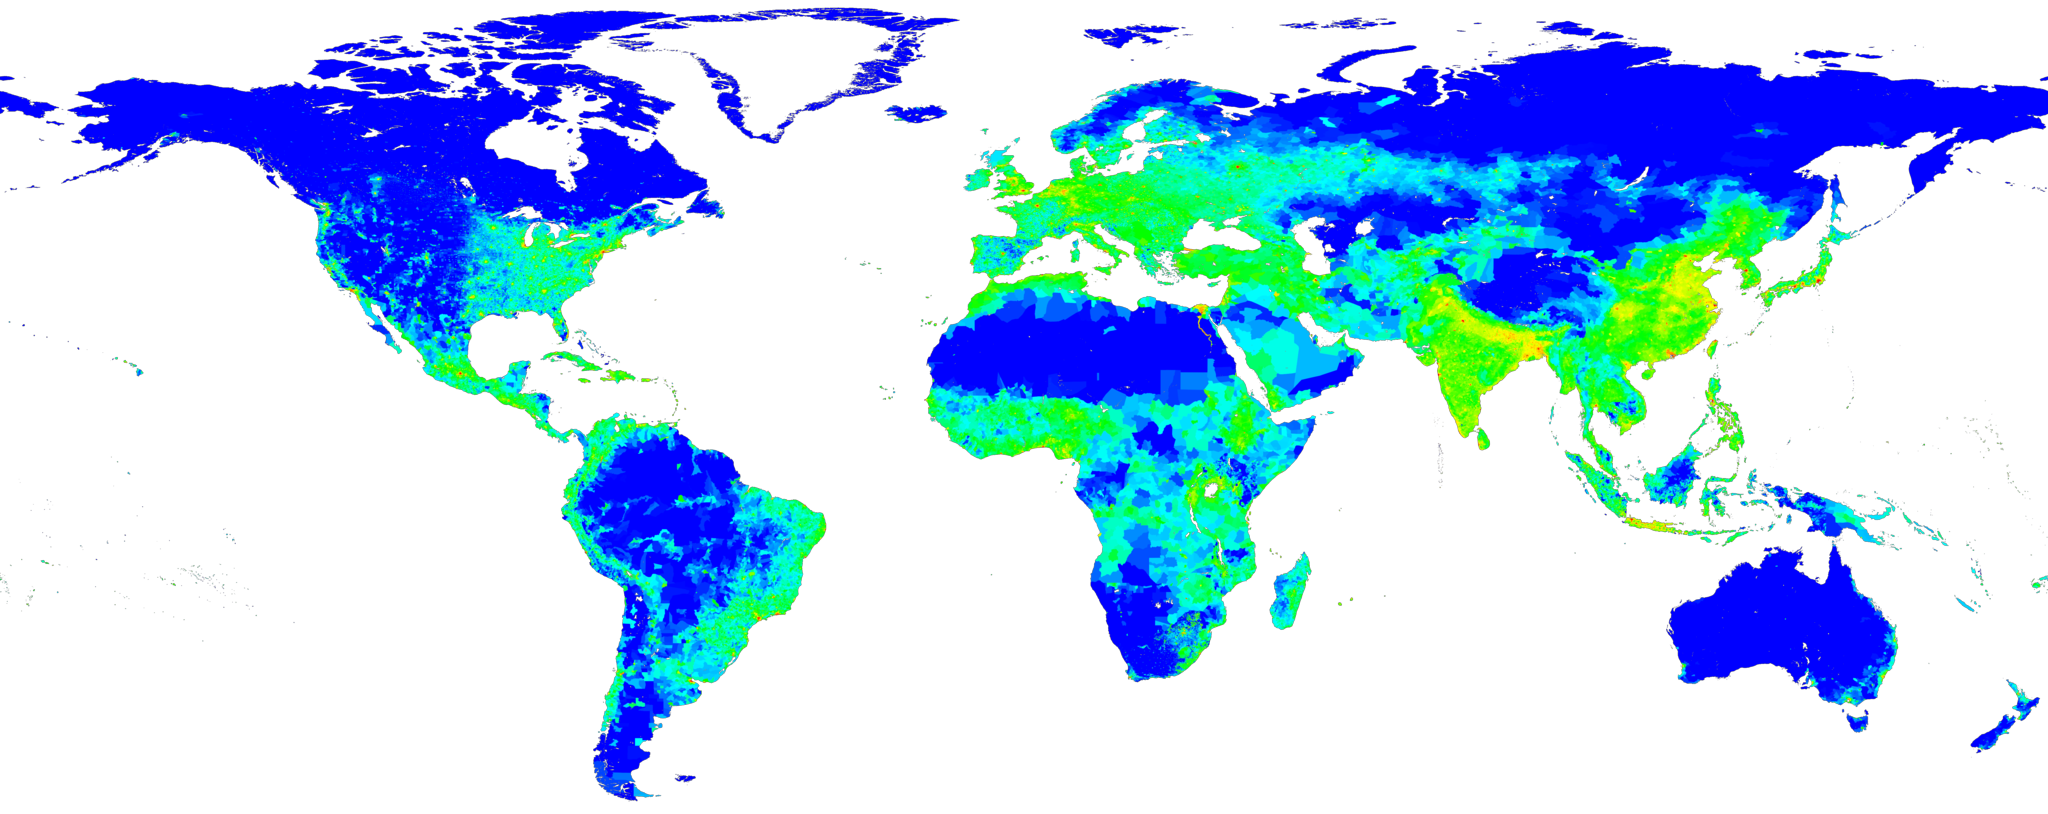
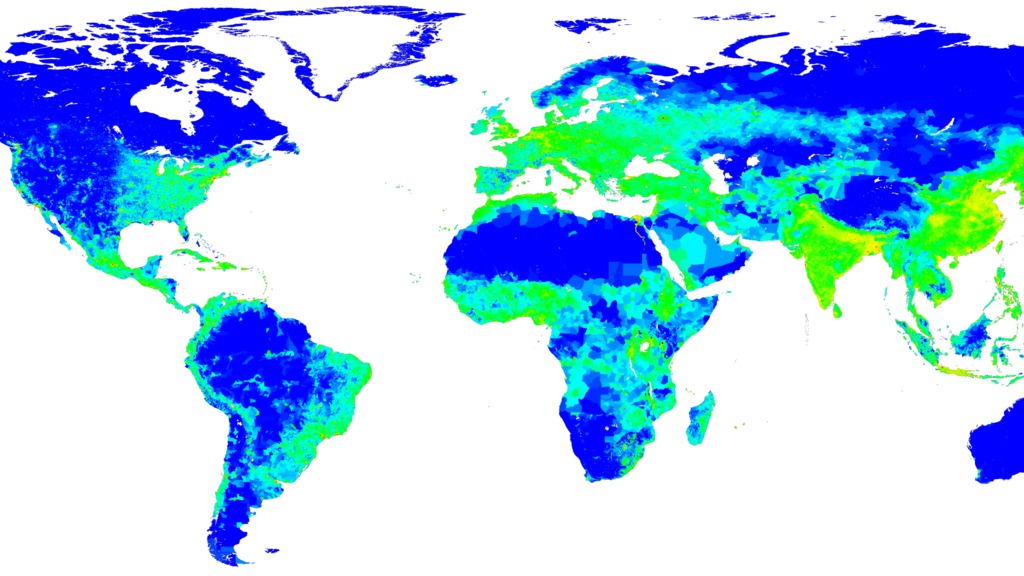
This animation shows the population density of the world in the years 1990, 1995, 2000, as well as a population density estimated for the year 2015. These figures have been adjusted to match United Nations totals. The most dramatic differences in population are not readily visible in this animation because they are located in cities. The maximum population density in 1990 was about 79,000 people per square kilometer, while the estimated maximum population density in 2015 will be about 236,000 people per square kilometer. Developing areas in Africa, Latin America, and Asia change the most visibly.
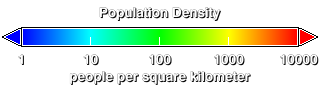
Population Density of the World, 1990-2015 (WMS)
Visualization Credits
Eric Sokolowsky (GST): Lead Animator
David Rogers (Oxford University): Scientist
Bob Venezia (NASA/HQ): Scientist
David Rogers (Oxford University): Scientist
Bob Venezia (NASA/HQ): Scientist
Please give credit for this item to:
NASA/Goddard Space Flight Center Scientific Visualization Studio, Gridded Population of the World (GPW), Version 3: 1990, 1995, 2000. Gridded Population of the World: Future Estimates, 2015. Center for International Earth Science Information Network (CIESIN), Columbia University; Food and Agricultural Organization (FAO); and Centro Internacional de Agricultura Tropical (CIAT), 2005. Available at (http://sedac.ciesin.columbia.edu/gpw).
NASA/Goddard Space Flight Center Scientific Visualization Studio, Gridded Population of the World (GPW), Version 3: 1990, 1995, 2000. Gridded Population of the World: Future Estimates, 2015. Center for International Earth Science Information Network (CIESIN), Columbia University; Food and Agricultural Organization (FAO); and Centro Internacional de Agricultura Tropical (CIAT), 2005. Available at (http://sedac.ciesin.columbia.edu/gpw).
Short URL to share this page:
https://svs.gsfc.nasa.gov/2912
Data Used:
Note: While we identify the data sets used in these visualizations, we do not store any further details nor the data sets themselves on our site.
This item is part of this series:
WMS
Keywords:
DLESE >> Human geography
SVS >> Population growth
GCMD >> Earth Science >> Human Dimensions >> Population >> Population Distribution
SVS >> Hyperwall
SVS >> For Educators
SVS >> Dynamics of Populations
NASA Science >> Earth
GCMD >> Earth Science >> Human Dimensions >> Population >> Population Density
GCMD keywords can be found on the Internet with the following citation: Olsen, L.M., G. Major, K. Shein, J. Scialdone, S. Ritz, T. Stevens, M. Morahan, A. Aleman, R. Vogel, S. Leicester, H. Weir, M. Meaux, S. Grebas, C.Solomon, M. Holland, T. Northcutt, R. A. Restrepo, R. Bilodeau, 2013. NASA/Global Change Master Directory (GCMD) Earth Science Keywords. Version 8.0.0.0.0
https://svs.gsfc.nasa.gov/2912
Data Used:
Gridded Population of the World (Version 3 Beta)
Data Compilation - SEDACThis item is part of this series:
WMS
Keywords:
DLESE >> Human geography
SVS >> Population growth
GCMD >> Earth Science >> Human Dimensions >> Population >> Population Distribution
SVS >> Hyperwall
SVS >> For Educators
SVS >> Dynamics of Populations
NASA Science >> Earth
GCMD >> Earth Science >> Human Dimensions >> Population >> Population Density
GCMD keywords can be found on the Internet with the following citation: Olsen, L.M., G. Major, K. Shein, J. Scialdone, S. Ritz, T. Stevens, M. Morahan, A. Aleman, R. Vogel, S. Leicester, H. Weir, M. Meaux, S. Grebas, C.Solomon, M. Holland, T. Northcutt, R. A. Restrepo, R. Bilodeau, 2013. NASA/Global Change Master Directory (GCMD) Earth Science Keywords. Version 8.0.0.0.0


