Greenland: East Coast Zoom-out With Ice Data
Dark blue indicates large amounts of ice loss, and light blue indicates lesser amounts of ice loss. This animation is match-moved to animation #587.
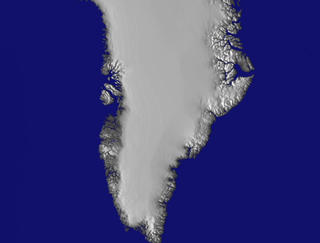
Zoom-out from the east coast of Greenland showing changes in ice thickness from 1993-1994 to 1998-1999 as measured by the Airborne Topographic Mapper

East coast of Greenland showing the largest area of ice-loss
Colorbar for Greenland
Video slate image reads, "Greenland Ice Changes (GIC 9)
Reverse of GIC 7. Camera starts on the east coast of Greenland centering on the area of elevation decrease and flies up to show the continent."
For More Information
Credits
Please give credit for this item to:
NASA/Goddard Space Flight Center
Scientific Visualization Studio
-
Animator
- Alex Kekesi (Global Science and Technology, Inc.)
-
Scientists
- Bob Bindschadler (NASA/GSFC)
- William Krabill (NASA/GSFC Wallops)
Release date
This page was originally published on Thursday, March 4, 1999.
This page was last updated on Wednesday, May 3, 2023 at 1:59 PM EDT.
Series
This visualization can be found in the following series:Papers used in this visualization
W. Krabill, E. Frederick, S. Manizade, C. Martin, J. Sonntag, R. Swift, R. Thomas, W. Wright, and J. Yungel, Rapid Thinning of Parts of the Southern Greenland Ice Sheet, Science, 283, n5407, pp 1522-1524, March 5, 1999
Datasets used in this visualization
-
[Airborne Topographic Mapper]
ID: 139
Note: While we identify the data sets used in these visualizations, we do not store any further details, nor the data sets themselves on our site.
Alternate Versions
- ID: 587
 Visualization