The Solar Dynamo: Plasma Flows
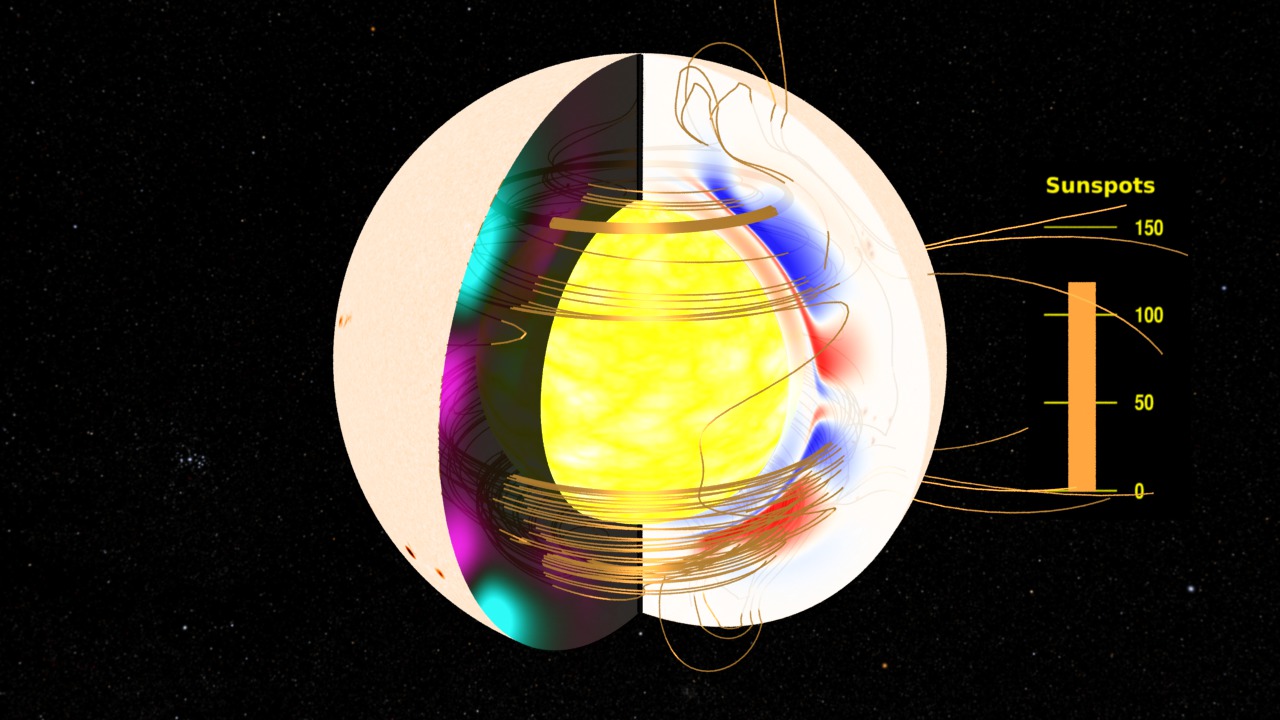
In this visualization, we illustrate the fluid flows in the Sun which drive the solar magnetic dynamo. The flows can be considered as a combination of two components, a toroidal component and a meridional component.
The toroidal flow corresponds to the rotational motion of the Sun. In the cut-away view, this motion is represented by the streaking flow vectors. The color code of the cross-section on the right-hand side illustrates the rotational period of this flow. Here we see that flow near the equator (in violet) takes about 24.5 days to make it all the way around the Sun. As we move to higher latitudes, we see that the flow gets steadily slower, increasing the time it takes to go around the Sun to as much as 34 days (in red) near the poles. A non-uniform fluid flow such as this is known as differential rotation. This motion in the interior can be measured at the solar surface through techniques of helioseismology.
Deeper into the Sun, we see the different colors of the outer layers transition to a solid color (olive green). This transition point is called the tachocline. It is the boundary between the outer zone of the Sun where thermal energy is transferred by convection (the convective zone), and the inner region of the Sun where thermal energy is transferred by radiation (the radiative zone). The radiative zone is believed to rotate as a solid body with a period of about 28 days in this model.
The yellow and white center in this model represents the solar radiative zone.
In the cross-section on the left-side, we represent the other component of the flow, called the meridional flow, which moves plasma between the equator and the polar regions.
These flows of solar plasma are used as input data for dynamo modeling (see The Solar Dynamo: Toroidal and Poloidal Fields and The Solar Dynamo: Toroidal and Radial Fields.)
This movie starts with a view of the Sun with sunspots changing as part of the solar cycle. The surface opens to reveal the interior flows of plasma.
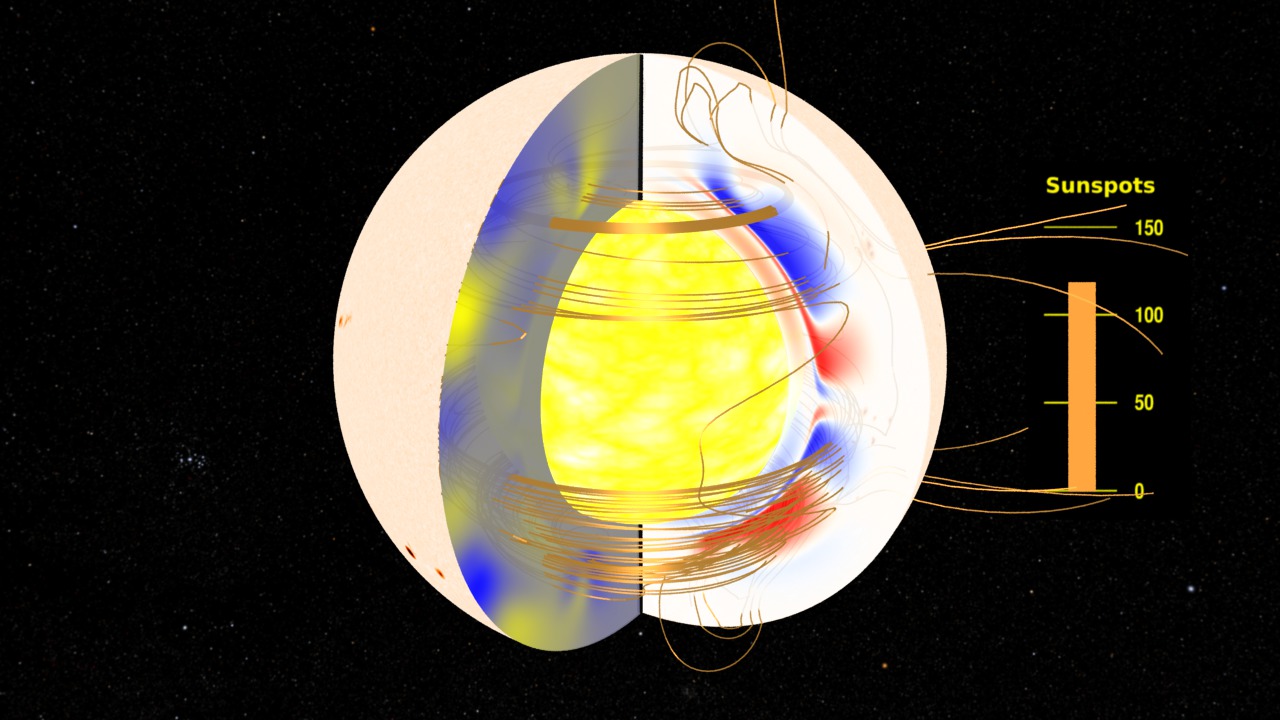
Same as movie above but with color bars.

Opening frame of the movie.
A view of the Sun with more sunspots.
A first view of the interior plasma flows. The right-hand cross-section is the toroidal flow. The left-hand cross section represents the meridional flow.
This frame is generated to match the frames in the magnetic field models.
This frame is generated to match the frames in the magnetic field models.
This frame is generated to match the frames in the magnetic field models.
This frame is generated to match the frames in the magnetic field models.
This frame is generated to match the frames in the magnetic field models.
Color bar for rotation period
Credits
Please give credit for this item to:
NASA/Goddard Space Flight Center Scientific Visualization Studio
-
Animator
- Tom Bridgman (Global Science and Technology, Inc.)
-
Scientists
- Andres Munoz-Jaramillo (Montana State University)
- Dibyendu Nandi (Indian Institute of Science Education and Research, Kolkata)
- William D. Pesnell (NASA/GSFC)
- Petrus C. H. Martens (Harvard Smithsonian Center for Astrophysics)
Release date
This page was originally published on Tuesday, August 19, 2008.
This page was last updated on Wednesday, November 15, 2023 at 12:00 AM EST.
Missions
This visualization is related to the following missions:Series
This visualization can be found in the following series:Papers used in this visualization
Datasets used in this visualization
-
Continuum [SOHO: Michelson Doppler Interferometer (MDI)]
ID: 619This dataset can be found at: http://sohowww.nascom.nasa.gov
See all pages that use this dataset
Note: While we identify the data sets used in these visualizations, we do not store any further details, nor the data sets themselves on our site.
Related
- ID: 3521
 Visualization
 - ID: 3583
 Visualization