The Solar Dynamo: Toroidal and Poloidal Magnetic Fields
Using the solar plasma flows as input (see The Solar Dynamo: Plasma Flows), the equations of magnetohydrodynamics, and 'seeding' the calculations with an initial small magnetic field, one can compute how a magnetic field can grow and be maintained. This is the dynamo process, the net result being that part of the Sun's outflowing thermal convective energy from nuclear processes is used to create the magnetic field.
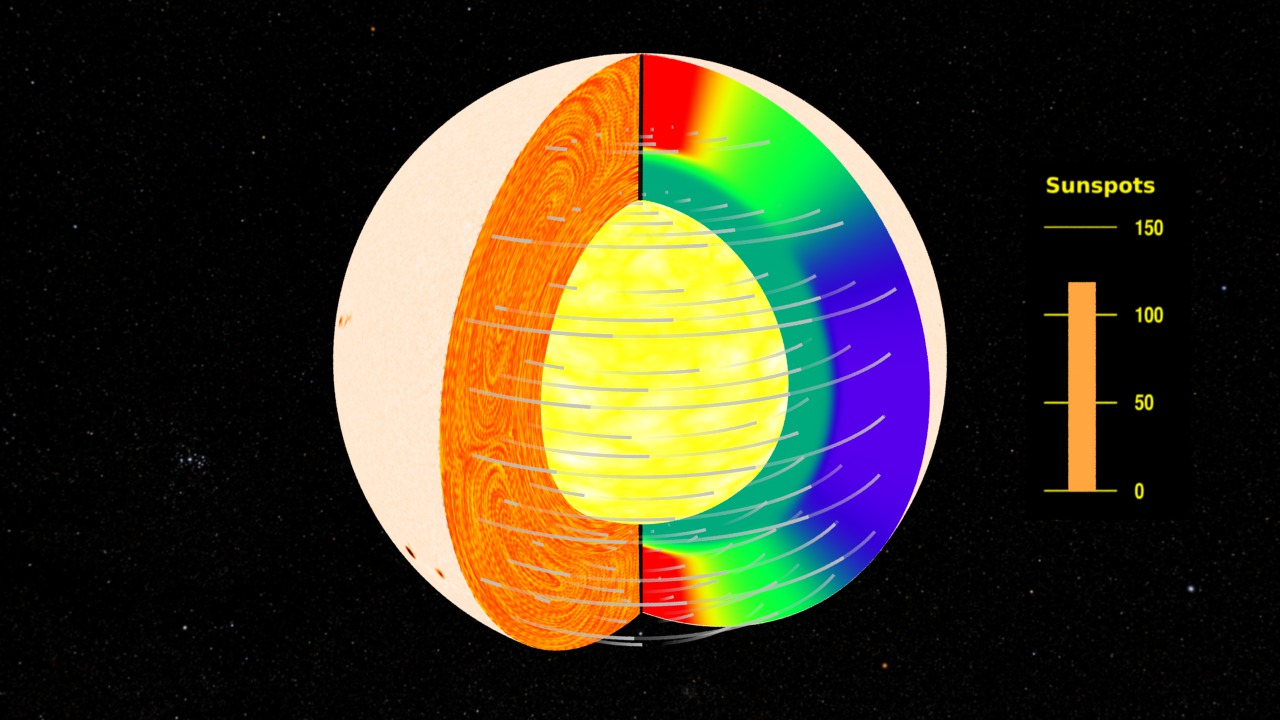
In this view of the solar dynamo mechanism, we examine the evolution of the toroidal magnetic field, the field intensity represented by colors on the right-hand cross-section, and the poloidal magnetic potential field, represented by colors on the left-hand cross-section. The poloidal magnetic potential is a scalar quantity that contains information about the radial and latitudinal magnetic field vectors. To see the radial magnetic field, see The Solar Dynamo: Toroidal and Radial Magnetic Fields.
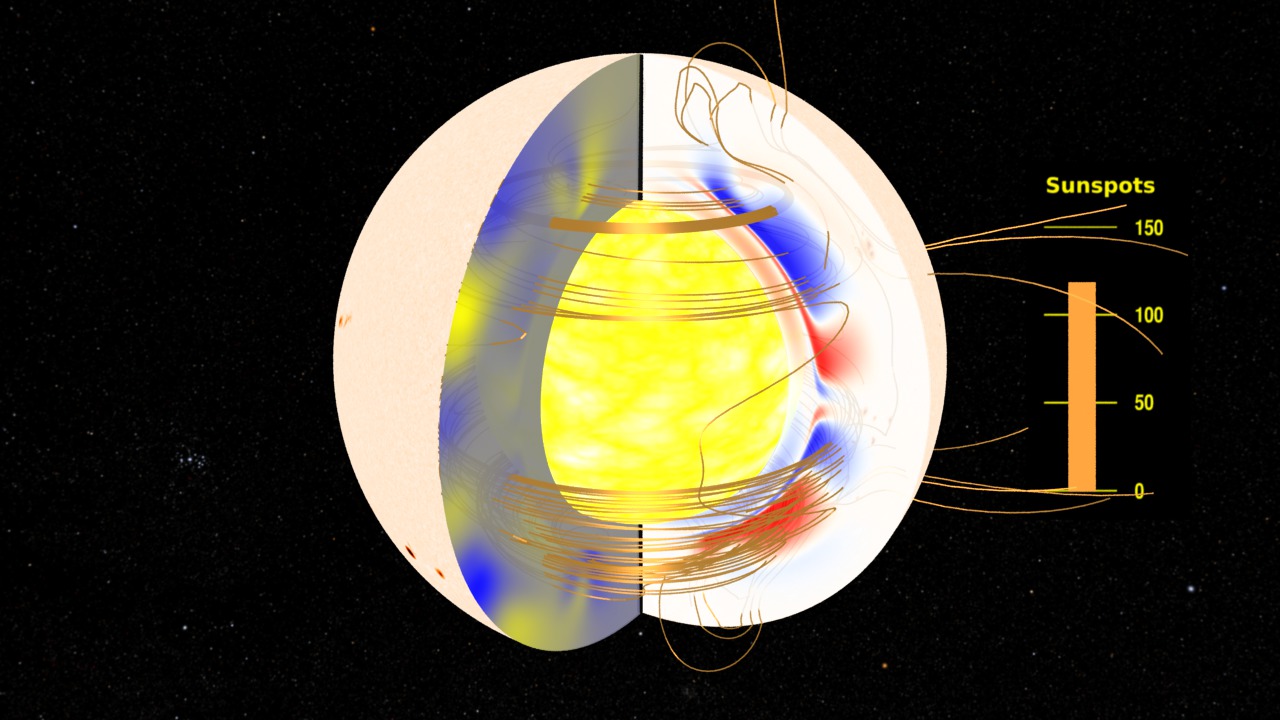
In this visualization, the magnetic field lines (represented by the 'copper wire' structures) are 'snapshots' of the field structure constructed at each time step of the model. These field lines should not be considered as 'moving' or 'stretching' as the model evolves in time.
Even this simplified model reproduces a number of characteristics observed in the actual solar magnetic field.
- Cyclic behavior with oscillations in the magnetic field amplitude.
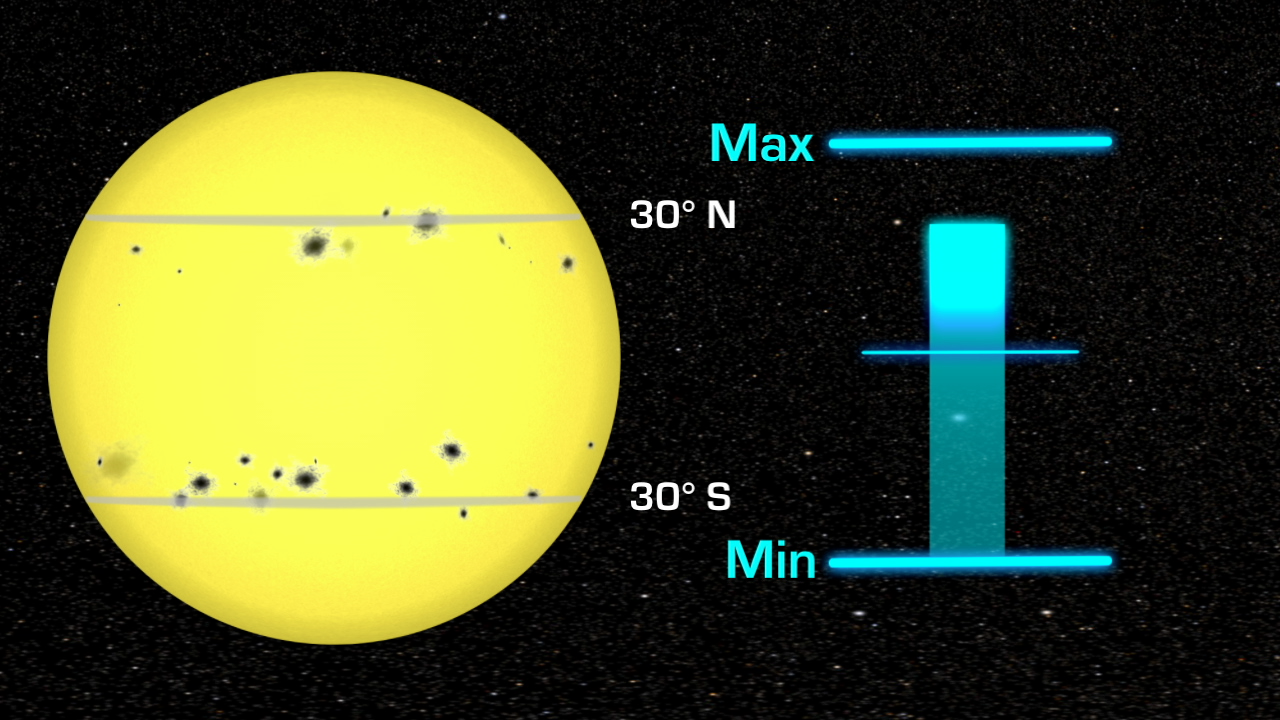
- Magnetic regions at the surface migrate from high latitudes towards the equator as the solar cycle progresses. This reproduces the "Butterfly Diagram" pattern.
- Surface magnetic polarities reverse with each cycle
Because this model is axisymmetric, it cannot simulate non-axisymmetric features such as active longitudes.
This movie starts with a view of the Sun with sunspots changing as part of the solar cycle. The surface opens to reveal the interior magnetic field structure.
Same as the movie above but with color bars.

Opening frame of the movie.
A view of the Sun with more sunspots.
Near solar minimum, we have relatively simple magnetic field line structures.
As the system evolves to sunspot maximum, the field lines in the polar regions become much more contorted.
Intense regions of the toroidal field exhibit tight bunches of field lines, so they look like a cable in this visual.
As the cycle is near minimum, field lines 'bunch up' much less.
Near maximum again, the field lines bunch up in regions of intense toroidal fields.
Another visit to solar minimum reveals deep mid-latitude structure in the magnetic field.
Color bar for poloidal magnetic potential field. This field displays as a normalized intensity to retain the polarity information.
Color bar for toroidal magnetic field vector
Credits
Please give credit for this item to:
NASA/Goddard Space Flight Center Scientific Visualization Studio
-
Animator
- Tom Bridgman (Global Science and Technology, Inc.)
-
Scientists
- Andres Munoz-Jaramillo (Montana State University)
- Dibyendu Nandi (Indian Institute of Science Education and Research, Kolkata)
- William D. Pesnell (NASA/GSFC)
- Petrus C. H. Martens (Harvard Smithsonian Center for Astrophysics)
Release date
This page was originally published on Tuesday, August 19, 2008.
This page was last updated on Wednesday, November 15, 2023 at 12:00 AM EST.
Missions
This visualization is related to the following missions:Series
This visualization can be found in the following series:Papers used in this visualization
Datasets used in this visualization
-
Continuum [SOHO: Michelson Doppler Interferometer (MDI)]
ID: 619This dataset can be found at: http://sohowww.nascom.nasa.gov
See all pages that use this dataset
Note: While we identify the data sets used in these visualizations, we do not store any further details, nor the data sets themselves on our site.
Related
- ID: 3496
 Visualization
 - ID: 3583
 Visualization
Used as a Source In
- ID: 10804
 Produced Video