Named Storms from the 2005 Atlantic Hurricane Season (Wide Shot)
An updated version of this visualization is available. Please see animation identification number 3354.
This visualization shows sea surface temperatures during most of the 2005 hurricane season. Overlaid are infrared cloud data, storm track data, and storm name labels. Ocean temperatures are the fuel that drive hurricanes. Notice the correspondence between the storm tracks and the sea surface temperature response; this is particulary noticeable for hurricanes Dennis, Emily, and Katrina. This versions shows a wide view of the Gulf of Mexico and Western Atlantic Ocean.
This visualization includes all of the named storms from Arlene though Wilma; however, Vince is not within the camera's view since it was in the Portugal/Spain region. Wilma tied the record for the most named Atlantic tropical storms in recorded history; and, the list of seleced names for this season is exhausted. Other storms that have formed after Wilma, have been named after the Greek alphabet.
The 2005 Hurricane season showing sea surface temperatures, clouds, and storm tracks
Animated GIF showing named Atlantic storms from 2005

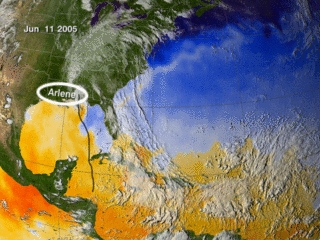
Arlene on June 11, 2005 at 23:15GMT
Bret on June 29, 2005 at 18:15 GMT
Cindy on July 6, 2005 at 10:15 GMT
Dennis on July 11, 2005 at 00:15 GMT
Emily on July 20, 2005 at 05:15 GMT
Franklin and Gert on July 24, 2005 at 19:15 GMT
Harvey on August 6, 2005 at 06:15 GMT
Irene on August 15, 2005 at 10:15 GMT
Jose on August 23, 2005 at 08:15 GMT
Katrina on August 30, 2005 at 00:15 GMT
Lee on August 31, 2005 at 16:15 GMT
Maria on August 8, 2005 at 04:15 GMT
Nate on September 9, 2005 at 10:15 GMT
Ophelia on September 16, 2005 at 22:15 GMT
Phillippe and Rita on September 24, 2005 at 21:15 GMT
Stan on October 4, 2005 at 21:15 GMT
Tammy on October 6, 2005 at 23:15 GMT
Vince on October 11, 2005 at 09:15 GMT
Wilma and Alpha on October 24, 2005 at 20:15 GMT
Beta on October 31, 2005 at 03:15 GMT
Gamma on November 19, 16:15 GMT
Delta on November 28, 2005 at 15:15 GMT
Epsilon on December 3, 2005 at 20:15 GMT
Credits
Please give credit for this item to:
NASA/Goddard Space Flight Center Scientific Visualization Studio
-
Animators
- Greg Shirah (NASA/GSFC)
- Alex Kekesi (Global Science and Technology, Inc.)
- Lori Perkins (NASA/GSFC)
- Horace Mitchell (NASA/GSFC)
-
Scientists
- J. Marshall Shepherd (NASA/GSFC)
- Jeff Halverson (JCET UMBC)
Release date
This page was originally published on Monday, October 17, 2005.
This page was last updated on Wednesday, May 3, 2023 at 1:56 PM EDT.
Missions
This visualization is related to the following missions:Datasets used in this visualization
-
Sea Surface Temperature [Aqua: AMSR-E]
ID: 238 -
Blue Marble [Aqua: MODIS]
ID: 252Credit: The Blue Marble data is courtesy of Reto Stockli (NASA/GSFC).
See all pages that use this dataset -
Hurricane/Tropical Data
ID: 282 -
Infrared [GOES-12: Imager]
ID: 316 -
Blue Marble [Terra: MODIS]
ID: 492Credit: The Blue Marble data is courtesy of Reto Stockli (NASA/GSFC).
See all pages that use this dataset
Note: While we identify the data sets used in these visualizations, we do not store any further details, nor the data sets themselves on our site.