27 Storms: Arlene to Zeta
Many records were broken during the 2005 Atlantic hurricane season including the most hurricanes ever, the most category 5 hurricanes, and the most intense hurricane ever recorded in the Atlantic as measured by atmospheric pressure. This visualization shows all 27 named storms that formed in the 2005 Atlantic hurricane season and examines some of the conditions that made hurricane formation so favorable.
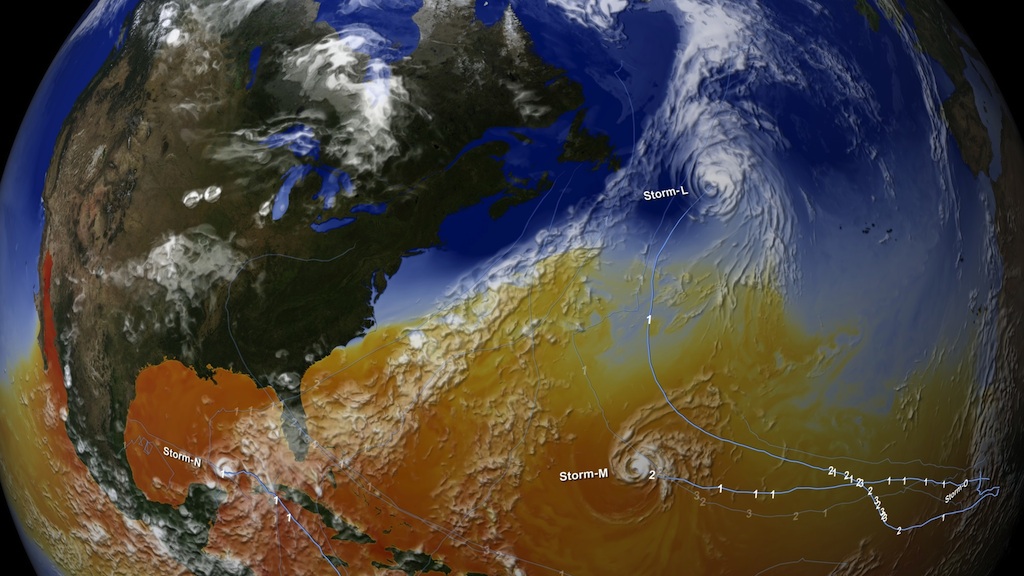
The animation begins by showing the regions of warm water that are favorable for storm development advancing northward through the peak of hurricane season and then receding as the waters cool. The thermal energy in these warm waters powers the hurricanes. Strong shearing winds in the troposphere can disrupt developing young storms, but measurements indicate that there was very little shearing wind activity in 2005 to impede storm formation.
Sea surface temperatures, clouds, storm tracks, and hurricane category labels are shown as the hurricane season progresses.
This visualization shows some of the actual data that NASA and NOAA satellites measured in 2005 — data used to predict the paths and intensities of hurricanes. Satellite data play a vital role in helping us understand the land, ocean, and atmosphere systems that have such dramatic effects on our lives.
NOTE: This animation shows the named storms from the 2005 hurricane season. During a re-analysis of 2005, NOAA's Tropical Prediction Center/National Hurricane Center determined that a short-lived subtropcial storm developed near the Azores Islands in late September, increasing the 2005 tropical storm count from 27 to 28. This storm was not named and is not shown in this animation.
'27 Storms: Arlene to Zeta' played in the SIGGRAPH 2007 Computer Animation Festival in August 2007. It was also a finalist in the 2006 NSF Science and Engineering Visualization Challenge.
Full version with audio and annotations
This video is also available on our YouTube channel.
Sea surface temperatures only
(without color bar)
Sea surface temperatures and clouds with annotations except storm menu and strengths

Hurricane Katrina on 28 August 2005
Hurricane Rita on 22 September 2005
Hurricane Wilma on 24 October 2005
Color bar for sea surface temperatures in degrees F: blues are less than 80 , white is about 82, yellows and reds are above 82
Sea surface temperature and clouds with no annotations other than storm tracks.
For More Information
Credits
Please give credit for this item to:
NASA/Goddard Space Flight Center Scientific Visualization Studio
Additional credits: Sea surface temperature Data by Remote Sensing Systems and sponsored by the NASA Earth Science REASoN DISCOVER Project and the AMSRE-E Science Team.
NCEP Cloud composite courtesy of NOAA's Climate Prediction Center.
Storm tracks and strenghts courtesy of NOAA's National Weather Service.
Blue Marble MODIS data composite courtesy of the MODIS Science Team NASA Goddard Space Flight Center and the NASA Earth Observatory.
Music created and produced by UniqueTracks. Fantasy (theme from Norma) - Vincenzo Bellini.
-
Animators
- Greg Shirah (NASA/GSFC)
- Alex Kekesi (Global Science and Technology, Inc.)
- Lori Perkins (NASA/GSFC)
- Horace Mitchell (NASA/GSFC)
- Stuart A. Snodgrass (Global Science and Technology, Inc.)
- Marte Newcombe (Global Science and Technology, Inc.)
- Randall Jones (Global Science and Technology, Inc.)
- Jeff de La Beaujardiere (NASA)
- Eric Sokolowsky (Global Science and Technology, Inc.)
- James W. Williams (Global Science and Technology, Inc.)
- Jesse Allen (Raytheon)
- Tom Bridgman (Global Science and Technology, Inc.)
-
Visualizer
- Cindy Starr (Global Science and Technology, Inc.)
-
Narrator
- Michael Starobin (HTSI)
-
Scientist
- Jeff Halverson (JCET UMBC)
-
Project support
- Kevin Mahoney (CSC)
- Joycelyn Thomson Jones (NASA/GSFC)
-
Writer
- Michael Starobin (HTSI)
Release date
This page was originally published on Wednesday, May 31, 2006.
This page was last updated on Wednesday, November 15, 2023 at 12:00 AM EST.
Series
This visualization can be found in the following series:Datasets used in this visualization
-
[GOES: IR4]
ID: 33 -
Sea Surface Temperature [Aqua: AMSR-E]
ID: 238 -
Hurricane/Tropical Data
ID: 282 -
Sea Surface Height Anomaly [TOPEX: Poseidon]
ID: 514
Note: While we identify the data sets used in these visualizations, we do not store any further details, nor the data sets themselves on our site.
Related
- ID: 11016
 Produced Video
 - ID: 10829
 Produced Video