The Best Observed X-class Flare
On March 29, 2014 the sun released an X-class flare. It was observed by NASA's Interface Region Imaging Spectrograph, or IRIS; NASA's Solar Dynamics Observatory, or SDO; NASA's Reuven Ramaty High Energy Solar Spectroscopic Imager, or RHESSI; the Japanese Aerospace Exploration Agency's Hinode; and the National Solar Observatory's Dunn Solar Telescope located at Sacramento Peak in New Mexico.
To have a record of such an intense flare from so many observatories is unprecedented. Such research can help scientists better understand what catalyst sets off these large explosions on the sun. Perhaps we may even some day be able to predict their onset and forewarn of the radio blackouts solar flares can cause near Earth – blackouts that can interfere with airplane, ship and military communications.
A web short about the multi-spacecraft observations of the March 29, 2014 X-class flare.
Watch this video on the NASAexplorer YouTube channel.
For complete transcript, click here.

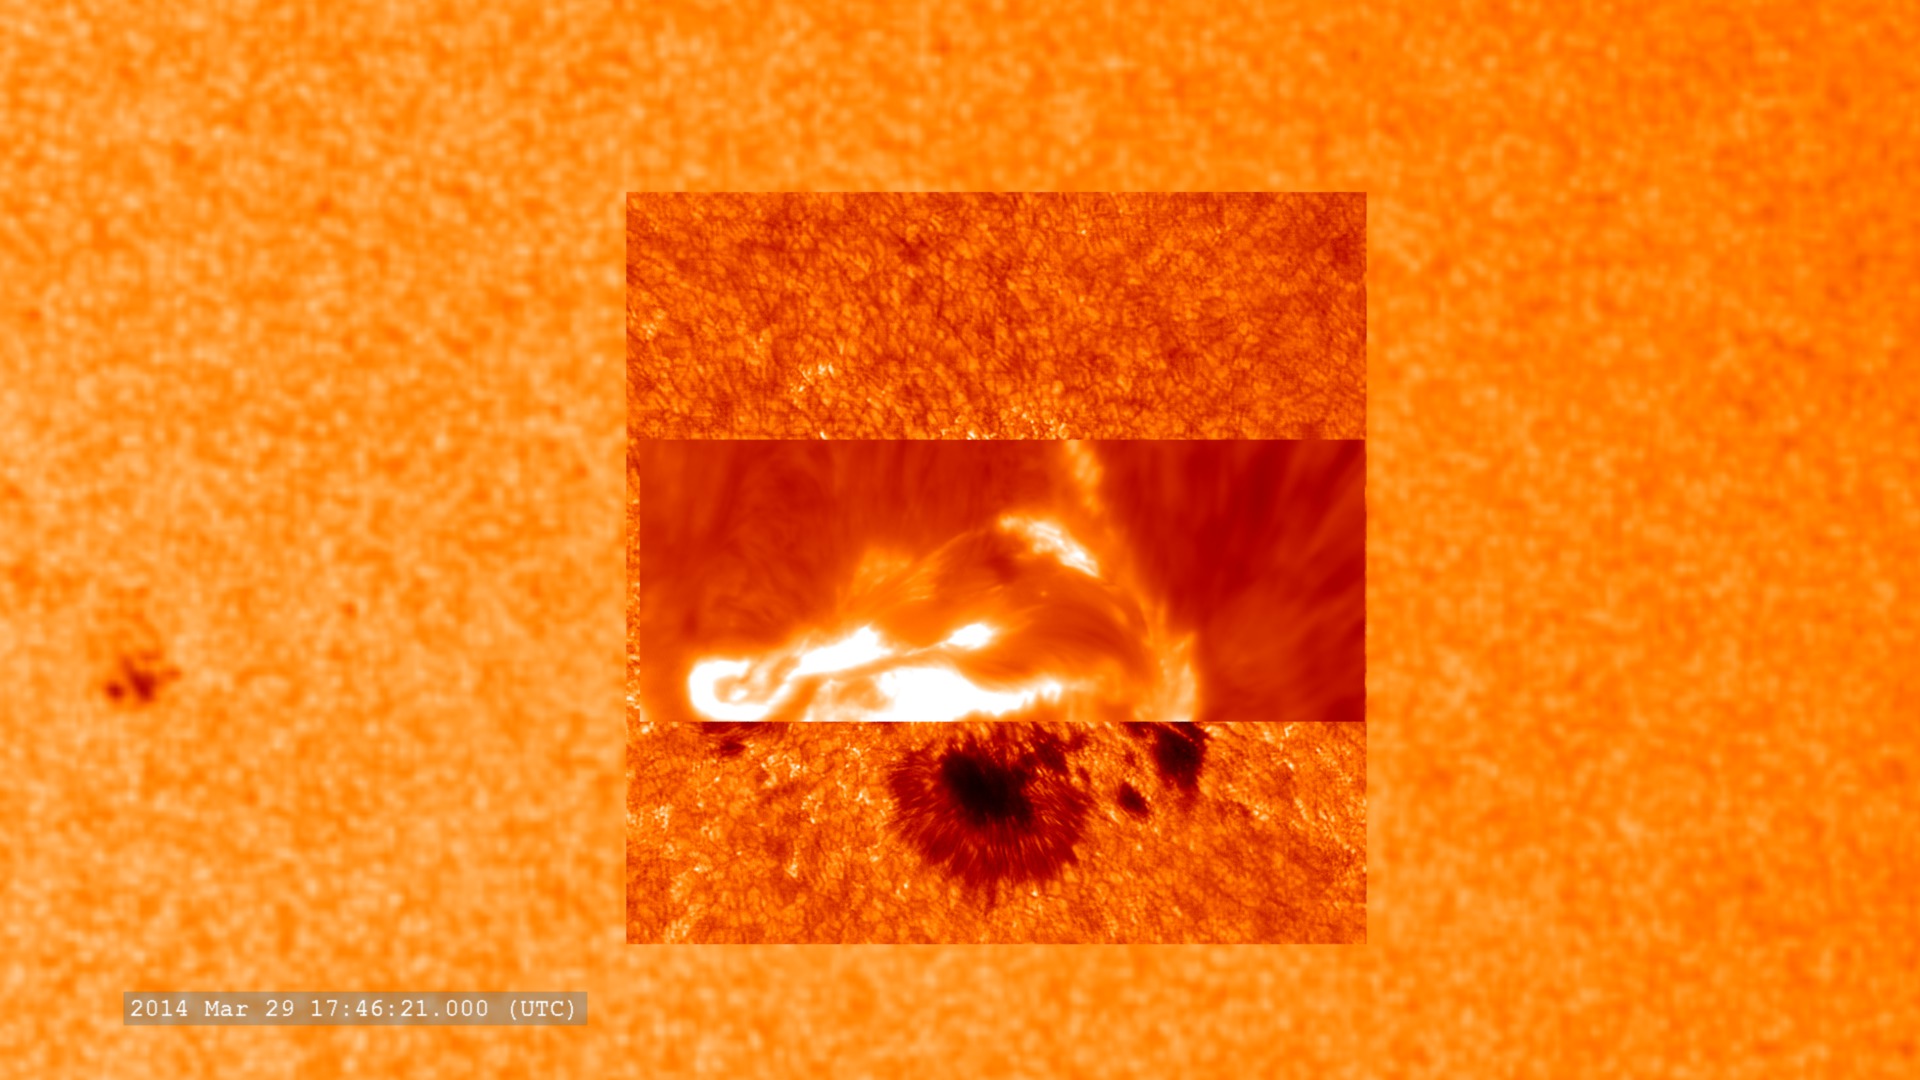
This combined image shows the March 29, 2014, X-class flare as seen through the eyes of different observatories. SDO is on the bottom/left, which helps show the position of the flare on the sun. The darker orange square is IRIS data. The red rectangular inset is from Sacramento Peak. The violet spots show the flare's footpoints from RHESSI.
The March 29, 2014, X-class flare appears as a bright light on the upper right in this image from SDO, showing light in the 304 angstrom wavelength. This wavelength shows material on the sun in what's called the transition region, where the chromosphere transitions into the upper solar atmosphere, the corona. Some light of the flare is clearly visible, but the flare appears brighter in other images that show hotter temperature material.
Credit: NASA/SDO/AIA
NASA's Solar Dynamics Observatory captures magnetic information about the surface of the sun. Dark areas in this image from 1:48 p.m. EDT on March 29, 2014, show where magnetic field lines point into the surface during the X-class flare. The white areas show where the field lines point out. This information helps unravel the complex magnetic system on and around the sun, which can lead to large eruptive events like solar flares.
Credit: NASA/SDO/HMI
In these images of the solar corona showing light in the 171 angstrom wavelength, the March 29, 2014, flare can barely be seen. However light in this wavelength does clearly show the beautiful loops of charged particles – tracing out the sun's magnetic field lines — that can clearly be seen rising up on the sun's horizon.
Credit: NASA/SDO/AIA
An image of the sun's surface, or photosphere, at 1:48 p.m. EDT on March 29, 2014, captured by the Helioseismic Magnetic Imager on NASA's Solar Dynamics Observatory.
Credit: NASA/SDO/HMI
The hottest solar material that SDO can focus in on is 10 million Kelvin, as seen in this image that shows light with a wavelength of 131 angstroms. At these temperatures, the blazingly hot solar flare can easily be seen in the upper right of the sun.
Credit: NASA/SDO/AIA
Moving up in the solar atmosphere, the bright light of the flare becomes visible. This image from the Atmospheric Imaging Assembly on NASA's Solar Dynamics Observatory shows ultraviolet light of 1700 angstroms. This wavelength of light shows materials with temperatures of about 4500 Kelvin, which highlights the surface of the sun and a low layer of the sun's atmosphere called the chromosphere.
Credit: NASA/SDO/AIA
A close-up of the sunspot at the root of the March 29, 2014, X-class flare. This image was taken using NASA's Solar Dynamics Observatory – which specializes in capturing images of the entire sun. Zooming in on a spot like this shows some detail but not at extremely high resolution.
Credit: NASA/SDO/HMI
Like almost all solar observatories, NASA's IRIS can provide images of different layers of the sun's atmosphere, which together create a whole picture of what's happening. This image shows light at a wavelength of 1400 angstrom, which highlights material some 650 miles above the sun's surface. The vertical line in the middle shows the slit for IRIS's spectrograph, which can separate light into its many wavelengths to provide even more information about the temperature and velocity of material during a flare.
Credit: NASA/IRIS/Goddard Space Flight Center
NASA's Interface Region Imaging Spectrograph, or IRIS, captured this image of the X-class flare. This is the first X-class flare that IRIS has ever observed, as the telescope's pointing must be programmed in at least a day in advance – too far ahead to know exactly where or when a flare might occur. With these observations, IRIS provided the first comprehensive data set of how heat and energy move through the low layers of the sun's atmosphere during an X-class flare.
Credit: NASA/IRIS
This close-up of the sunspot underneath the March 29, 2014, flare shows incredible detail. The image was captured by the G-band camera at Sacramento Peak in New Mexico. This instrument can focus on only a small area at once, but provide very high resolution. Ground-based telescope data can be hindered by Earth's atmosphere, which blocks much of the sun's ultraviolet and X-ray light, and causes twinkling even in the light it does allow through. As it happens, the March 29 flare occurred at a time of day in New Mexico that often results in the best viewing times from the ground.
Credit: Kevin Reardon (National Solar Observatory), Lucia Kleint (BAER Institute)
An image from the ground-based Interferometric Bidimensional Spectrometer, or IBIS, at the National Solar Observatory's Sacramento Peak is overlaid on an image of the sun's surface. A thin bright line can be seen on the left, which is known as a flare ribbon. This flare ribbon lies right over one of the footpoints of the flare seen in other images, such as those from NASA's RHESSI. The other footpoint isn't visible in this image.
Credit: Alberto Sainz Dalda (Stanford University), Kevin Reardon (NSO)
IBIS can focus in on different wavelengths of light, and so reveal different layers at different heights in the sun's lower atmosphere, the chromosphere. This image shows a region slightly higher than the former one.
Credit: Lucia Kleint (BAER Institute), Paul Higgins (Trinity College Dublin, Ireland)
Each of these images from the Japan Aerospace Exploration Agency's and NASA's Hinode shows a progressively higher layer of the sun's atmosphere. The upper left corner shows material in a low part of the atmosphere, called the chromosphere – and the images progress ever upward through the heart of the flare up to over 3,000 miles above the surface in the image on the lower right. Each image shows a narrow swatch of the flare, which together can be combined to create a 3-dimensional picture. The images were captured by the EUV Imaging Spectrometer instrument on Hinode.
Credit: JAXA/NASA/Hinode/EIS
This image of the solar surface — captured just as the flare peaked at 1:48 p.m. EDT, by the Solar Optical Telescope on the Japan Aerospace and Exploration Agency's and NASA's Hinode spacecraft – is what's called a magnetogram. The dark spots show where magnetic field lines travel in to the sun and the light regions show where they travel out. The intense white line on the left and the lower dark U-shape on the right, represent the footprints of the flare. Using these magnetograms, researchers were able to map the magnetic field's strength and direction change just before a flare in one of the highest resolution and best data sets ever gathered.
Credit: JAXA/NASA/Hinode
NASA's Reuven Ramaty High Energy Solar Spectroscopic Imager, or RHESSI, observes both the intense particle acceleration caused by the flare and the hottest temperature material. The image on the left shows where flare-accelerated electrons interact with the chromosphere at the footpoints of the flare, which are situated above the sunspots seen on the surface of the sun in other images. The image on the right shows the 25 million Kelvin material higher in the flare loop in the corona.
Credit: NASA/RHESSI
Not all solar observations come looking like pretty pictures. This data shoes how the National Oceanic and Atmospheric Administration's Geostationary Operational Environmental Satellite, or GOES, recorded the X-class flare. Note the high spike just before 18:00 – the Universal Time equivalent of 2:00 p.m. EDT — on March 29. That spike shows how GOES detected a surge in X-rays from the sun, the signature of a solar flare.
Credits
Please give credit for this item to:
NASA's Goddard Space Flight Center
-
Animators
- Tom Bridgman (Global Science and Technology, Inc.)
- Walt Feimer (HTSI)
- Chris Meaney (HTSI)
-
Video editor
- Genna Duberstein (USRA)
-
Narrator
- Karen Fox (ADNET Systems, Inc.)
-
Producer
- Genna Duberstein (USRA)
-
Scientists
- Adrian Daw (NASA/GSFC)
- William D. Pesnell (NASA/GSFC)
- Lucia Kleint (BAER Institute)
- Albert Shih (NASA/GSFC)
-
Project support
- Aaron E. Lepsch (ADNET Systems, Inc.)
-
Writer
- Karen Fox (ADNET Systems, Inc.)
Release date
This page was originally published on Wednesday, May 7, 2014.
This page was last updated on Wednesday, May 3, 2023 at 1:50 PM EDT.
Series
This visualization can be found in the following series:Tapes
This visualization originally appeared on the following tapes:-
One X-class Flare, Observed Four Ways
(ID: 2014035)
Monday, April 14, 2014 at 4:00AM
Produced by - Will Duquette (NASA)
Related
- ID: 4164