A Multi-Mission View of a Solar Flare: Optical to Gamma-rays
To improve our understanding of complex phenomena such as solar flares, a wide variety of tools are needed. In the case of astronomy, those tools enable us to analyze the light in many different wavelengths and many different ways.
Many different instruments are observing the Sun almost continuously, both from space and on the surface of the Earth. On March 29, 2014, the Dunn Solar Telescope at Sacramento Peak, New Mexico was observing a solar active region and requested other observatories to watch as well. As a result of this coordination, the region was being observed by a large number of different instruments, ground and space-based, when it subsequently erupted with an X-class flare.
This visualization presents various combinations of the datasets collected during this effort. The color text represents the dominant color of the dataset in the imagery.
- Solar Dynamics Observatory (SDO): HMI (617.1nm). This data represents the Sun is visible light similar to how we see it from the ground.
- Solar Dynamics Observatory (SDO): AIA (17.1nm). Solar ultraviolet emission, which can only be seen from space, reveals plasma flowing, and escaping, along magnetic fields.
- IRIS Slit-Jaw Imager: 140.0nm. This high-resolution imager also contains a slit (the dark vertical line in the center of the field) which directs the light to an ultraviolet spectrometer which is used to extract even more information about the light. The imager slews back-and-forth across the region, providing spectra over a larger area of the Sun.
- Hinode/X-ray Telescope: x-ray band. Indicates very hot plasma.
- RHESSI: 50-100 keV. High-energy gamma-ray emission. Emission from these locations represent the very highest energy photons from the flare event.
- Dunn Solar Telescope: G-band filter. This filter, showing much of the solar surface (photosphere) in visible light, provides a detailed view of the sunspots and convection cells. The view moves because the instrument was repointed several times during the observation.
- Dunn Solar Telescope: IBIS ( Hydrogen alpha, 656.3nm; Calcium 854.2 nm; Iron 630.15nm). This is the small rectangular view within the Dunn Solar Telescope G-band view. This instrument can tune the wavelength during the observation, which provides views of the solar atmosphere at different depths.
A view of the visible light solar disk from SDO/HMI and zoom-in to show visible light, hydrogen-alpha, and a calcium line from the Sacremento Peak observatory.
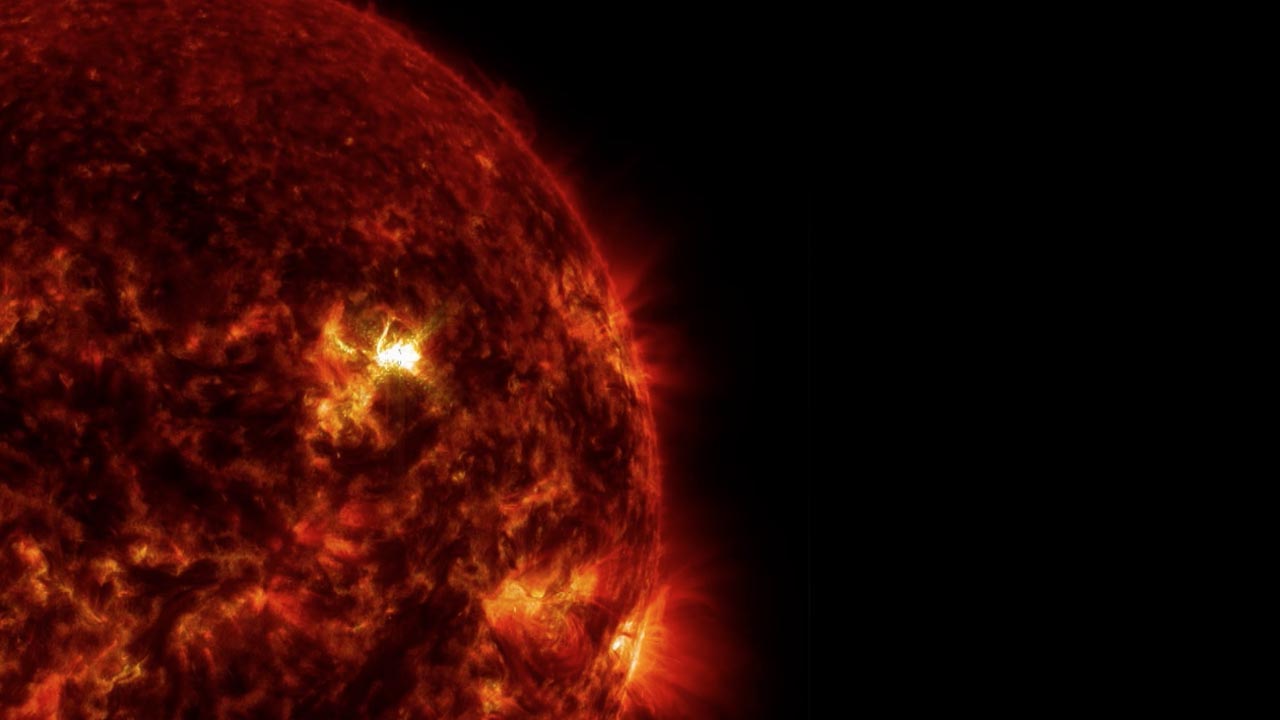
A closeup view of the loops and flare from SDO/AIA in the 17.1nm wavelength. Close-up view has same field-of -view as others in this series.
A close-up view featuring SDO/AIA 17.1nm with the inset showing IRIS Slit-Jaw Imager at 140.0nm. During the height of the flare, we see gamma-ray emission (violet) observed by RHESSI.
Zoom in on the flare in ultraviolet (SDO/AIA), X-rays (Hinode) and gamma-rays (RHESSI)
A combination of many (but not all) of the datasets which observed this flare.
A full disk view of the flare event from SDO/AIA 17.1nm filter.
A full disk view of the flare event from SDO/AIA 19.3nm filter.
A full disk view of the flare event from SDO/AIA 30.4 nm filter.
A full disk view of the flare event from SDO/HMI filter. Not much changing in the visible light view.
Supplemental movies with a zoom-in from SDO/AIA 30.4nm to IRIS 140.0nm view.
Supplemental movies with a zoom-in from SDO/AIA 30.4nm to IRIS 279.6nm view.
Credits
Please give credit for this item to:
NASA's Scientific Visualization Studio, the SDO Science Team, the Virtual Solar Observatory and the BAER Institute.
-
Animator
- Tom Bridgman (Global Science and Technology, Inc.)
-
Producer
- Genna Duberstein (USRA)
-
Scientists
- William D. Pesnell (NASA/GSFC)
- Lucia Kleint (BAER Institute)
- Albert Shih (NASA/GSFC)
- Adrian Daw (NASA/GSFC)
-
Project support
- Laurence Schuler (ADNET Systems, Inc.)
- Ian Jones (ADNET Systems, Inc.)
Release date
This page was originally published on Wednesday, May 7, 2014.
This page was last updated on Wednesday, May 3, 2023 at 1:50 PM EDT.
Missions
This visualization is related to the following missions:Datasets used in this visualization
-
[RHESSI: X-ray Imaging Spectrometer]
ID: 101The RHESSI instrument is an imaging spectrometer observing the Sun at X-ray to gamma-rays (photon energies of 3 keV to 17 MeV) at time resolutions of a few seconds. (eV stands for "electron volt" and is a unit of energy. Note that photons of visible light have energies of 2-3 eV. 1 keV is a thousand electron volts and 1 MeV is a million electron volts.
This dataset can be found at: http://hesperia.gsfc.nasa.gov/hessi/
See all pages that use this dataset -
SDO Continuum (Continuum) [SDO: HMI]
ID: 674 -
AIA 171 (171 Filter) [SDO: AIA]
ID: 680This dataset can be found at: http://jsoc.stanford.edu/
See all pages that use this dataset -
Slit-Jaw Imager (SJI) [IRIS: Imager]
ID: 816This dataset can be found at: https://iris.lmsal.com/data.html
See all pages that use this dataset -
Hinode XRT [Hinode: X-ray Telescope (XRT)]
ID: 824 -
[Sacramento Peak Observatory/NSO]
ID: 825
Note: While we identify the data sets used in these visualizations, we do not store any further details, nor the data sets themselves on our site.
Related
- ID: 11522
 Produced Video