IRIS: Studying the Energy Flow that Powers the Solar Atmosphere
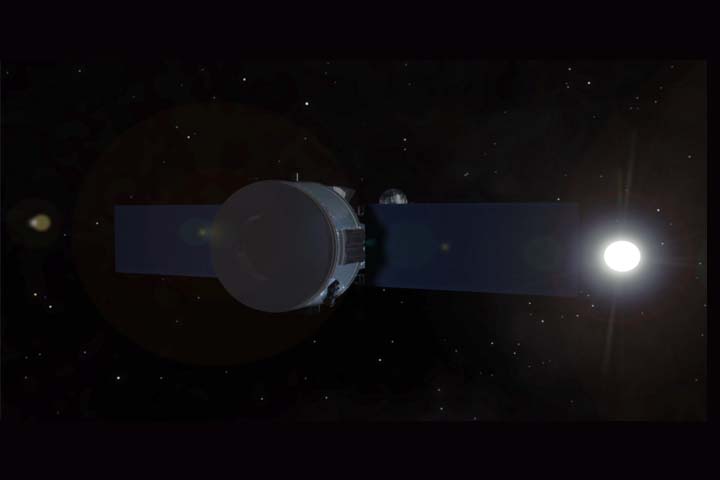
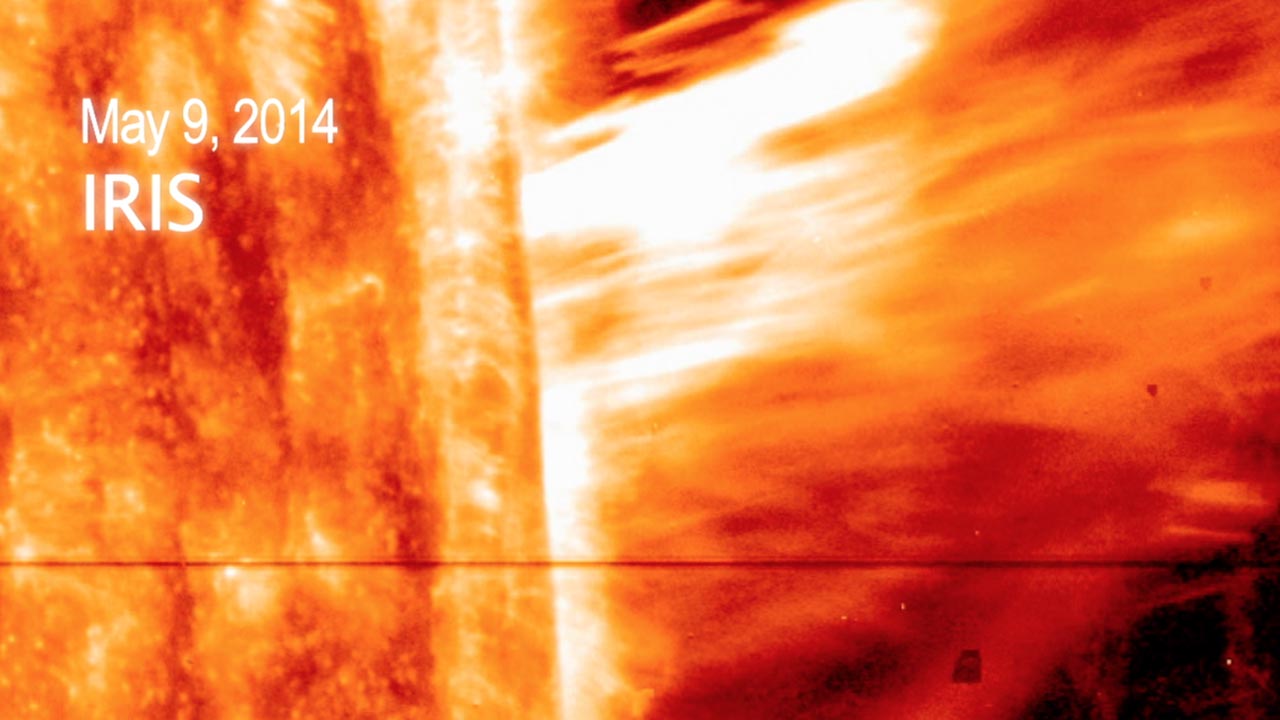
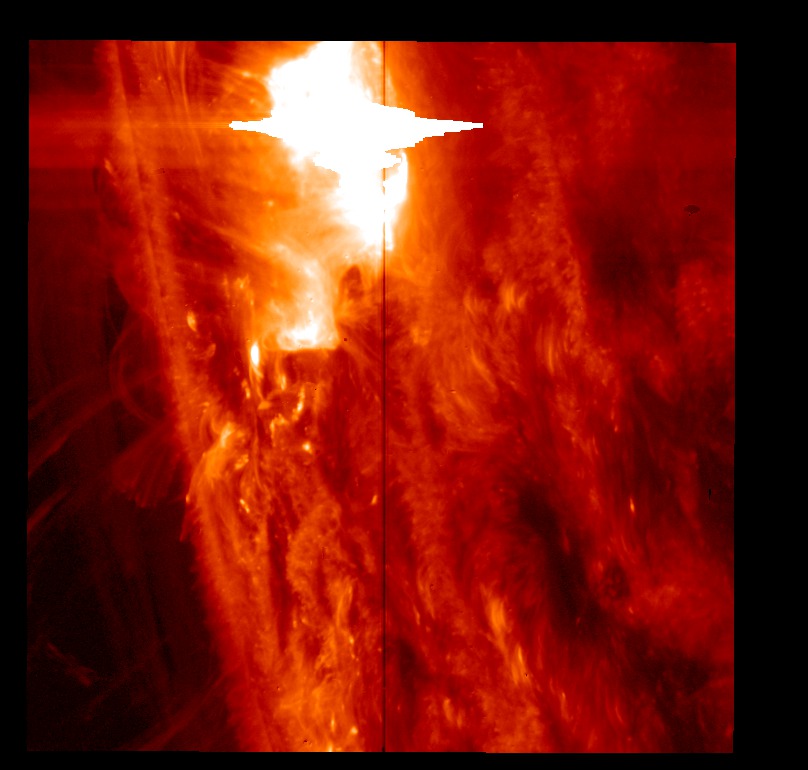
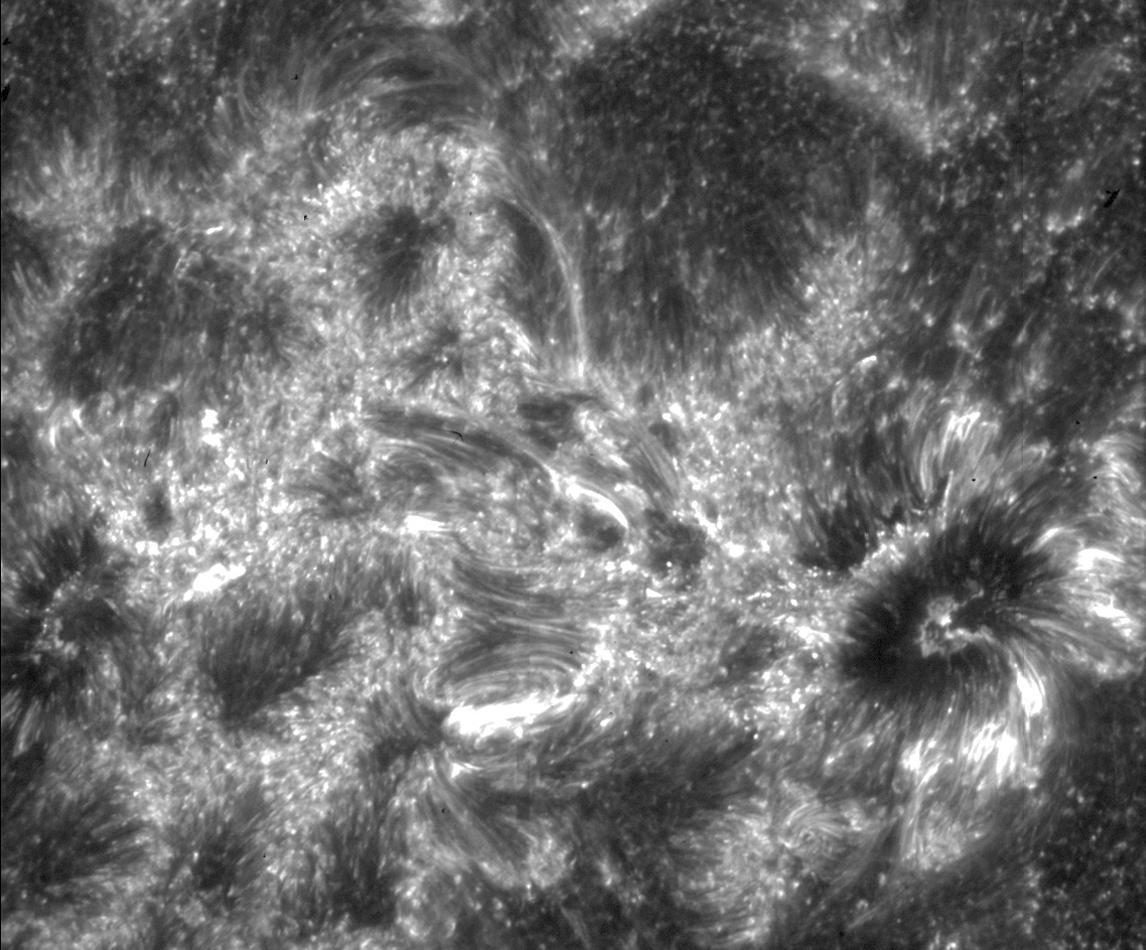
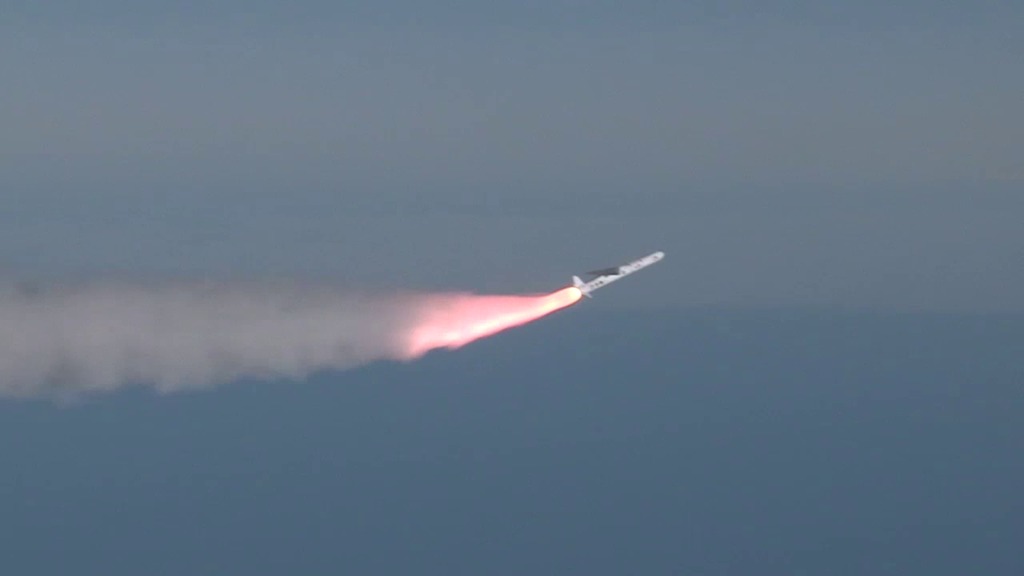
In late June 2013, the Interface Region Imaging Spectrograph, or IRIS, will launch from Vandenberg Air Force Base, Calif. IRIS will tease out the rules governing the lowest layers of the solar atmosphere — historically some of the hardest to untangle. Known as the solar interface region, this is one of the most complex areas in the sun's atmosphere: all the energy that drives solar activity travels through it. The interface region lies between the sun’s 6,000-degree, white-hot, visible surface, the photosphere, and the much hotter multi-million-degree upper corona. Interactions between the violently moving plasma and the sun’s magnetic field in this area may well be the source of the energy that heats the corona to its million-degree temperatures, some hundreds and occasionally thousands of times hotter than the sun's surface. The chromosphere is also considered a candidate as the origin for giant explosions on the sun such as solar flares and coronal mass ejections. IRIS will use high-resolution images, data and advanced computer models to unravel how solar gases move, gather energy and heat up through the lower solar atmosphere. Outfitted with state-of-the-art tools, IRIS will be able to tease apart what's happening in the solar interface region better than ever before.
IRIS Science Overview
View the video on YouTube.
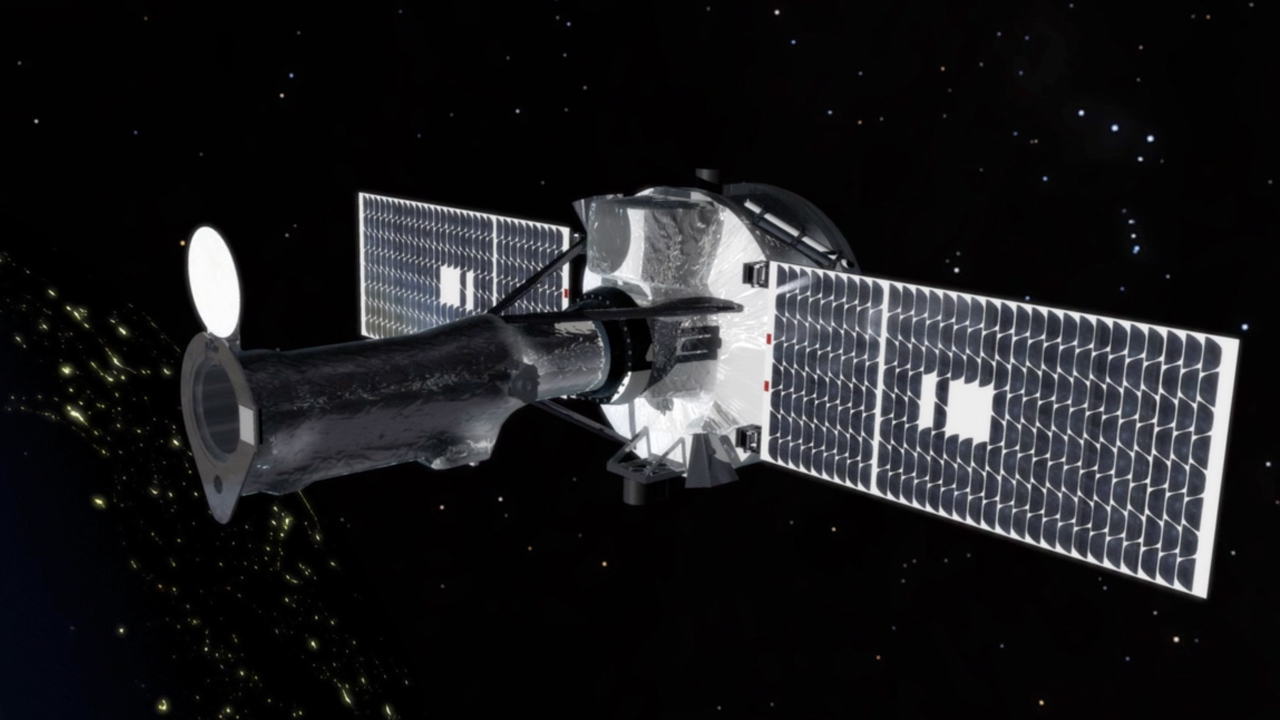
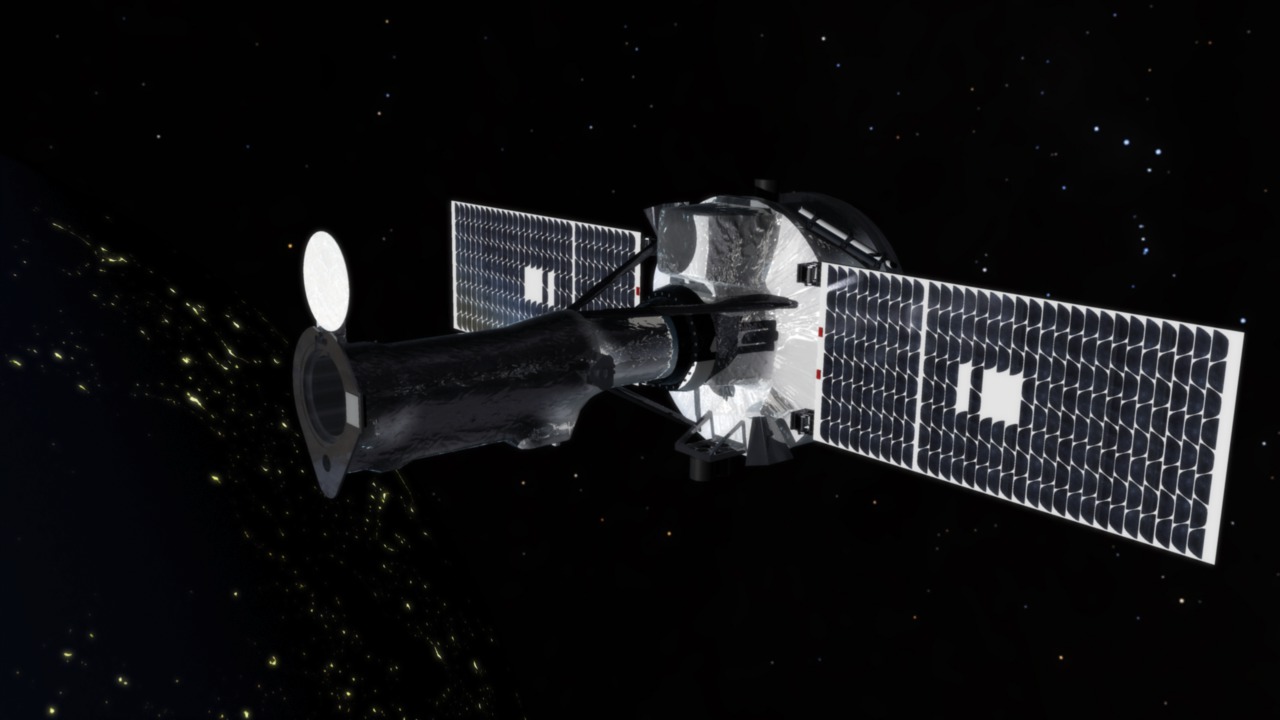
At the end of June 2013, NASA will launch its newest mission to watch the sun: the Interface Region Imaging Spectrograph, or IRIS. IRIS will show the lowest levels of the sun’s atmosphere, the interface region, in more detail than has even been observed before. This will help scientists understand how the energy dancing through this area helps power the sun’s million-degree upper atmosphere, the corona, as well as how this energy powers the solar wind constantly streaming off the sun to fill the entire solar system.
Data visualizations courtesy of Mats Carlsson and Viggo Hansteen, University of Oslo, Norway
For complete transcript, click here.
Credits
Please give credit for this item to:
NASA's Goddard Space Flight Center
-
Animators
- Walt Feimer (HTSI)
- Michael Lentz (USRA)
- Genna Duberstein (USRA)
-
Video editor
- Genna Duberstein (USRA)
-
Interviewee
- Adrian Daw (NASA/GSFC)
-
Narrator
- Chris Meaney (HTSI)
-
Producer
- Genna Duberstein (USRA)
-
Scientist
- Adrian Daw (NASA/GSFC)
-
Videographers
- Rob Andreoli (Advocates in Manpower Management, Inc.)
- John Caldwell (Advocates in Manpower Management, Inc.)
Release date
This page was originally published on Wednesday, June 19, 2013.
This page was last updated on Wednesday, May 3, 2023 at 1:52 PM EDT.
Missions
This visualization is related to the following missions:Series
This visualization can be found in the following series:Tapes
This visualization originally appeared on the following tapes:-
IRIS Science Overview
(ID: 2013039)
Wednesday, June 19, 2013 at 4:00AM
Produced by - Will Duquette (NASA)
Related
- ID: 11897
 Produced Video
 - ID: 11556
- ID: 11483
 Produced Video
 - ID: 11314
 Produced Video
 - ID: 11313
 Produced Video
 - ID: 11286
 Produced Video
 - ID: 11089
 Produced Video